I'm the first Front End Developer hired by this company, so all decisions regarding technologies and architecture are up to me. This provides great freedom in choosing how to build the product, but it also comes with a lot of responsibility to make sure the choices are reliable and scalable.
Projects
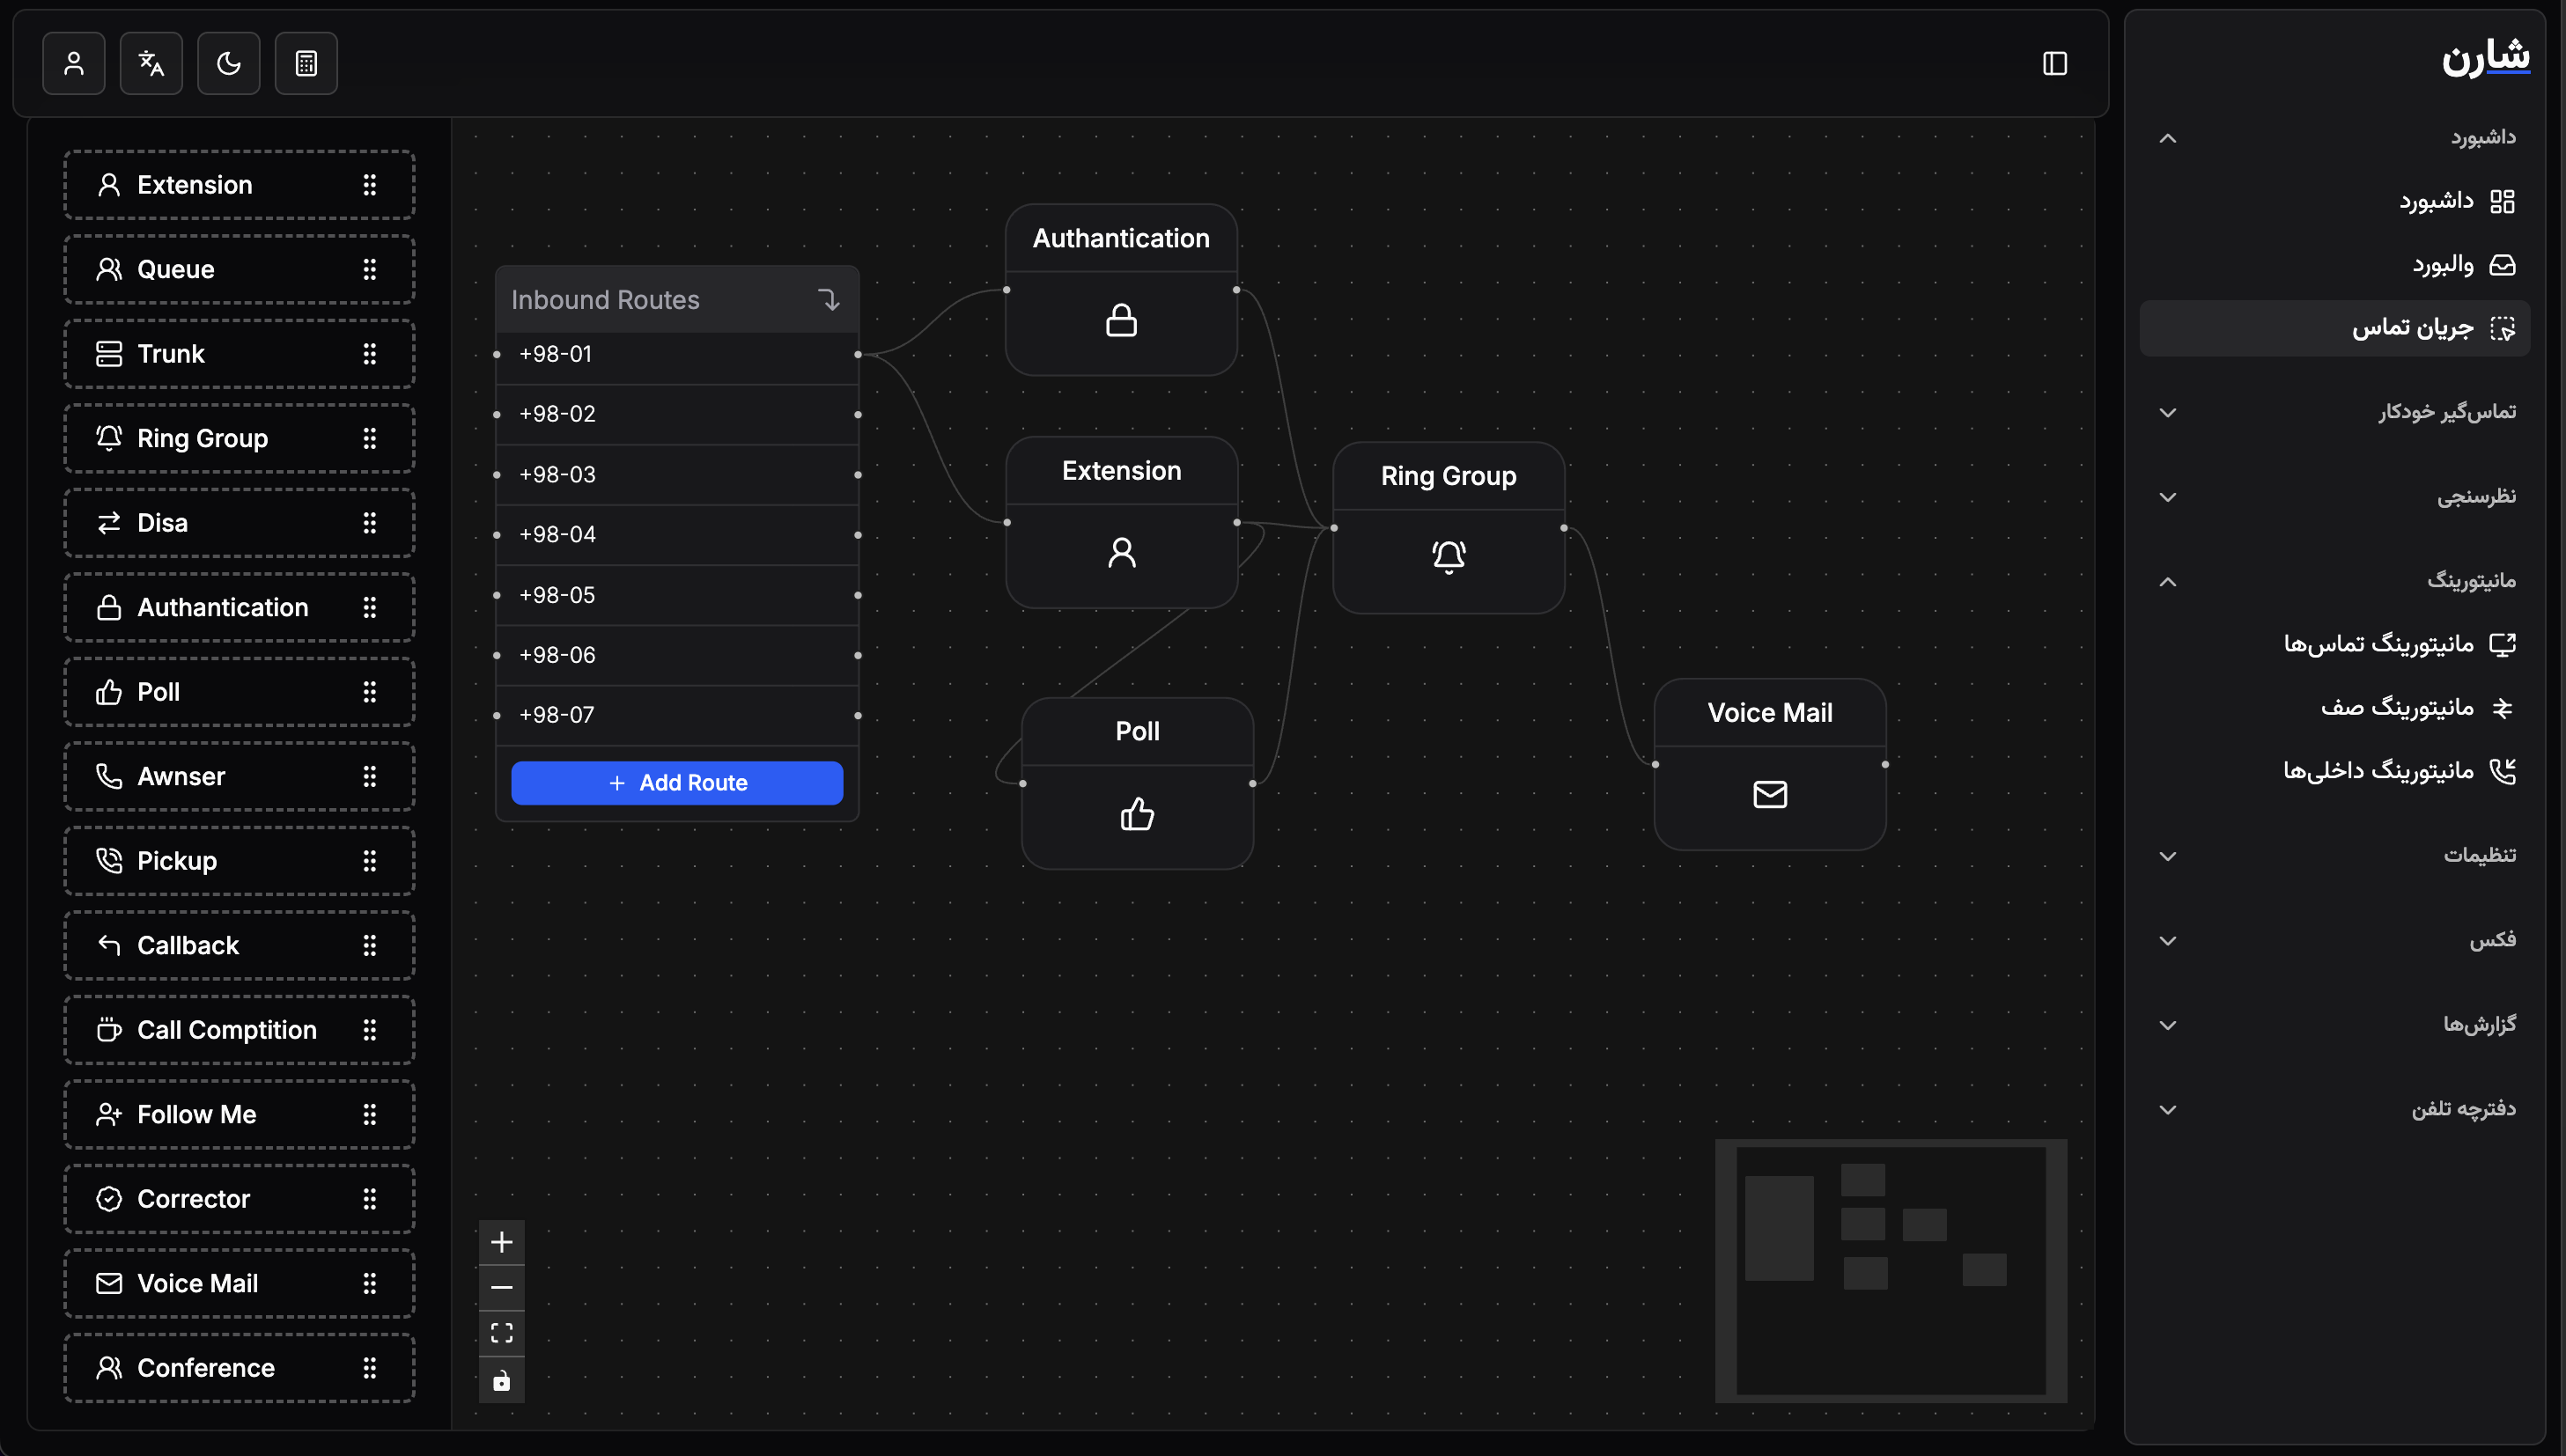
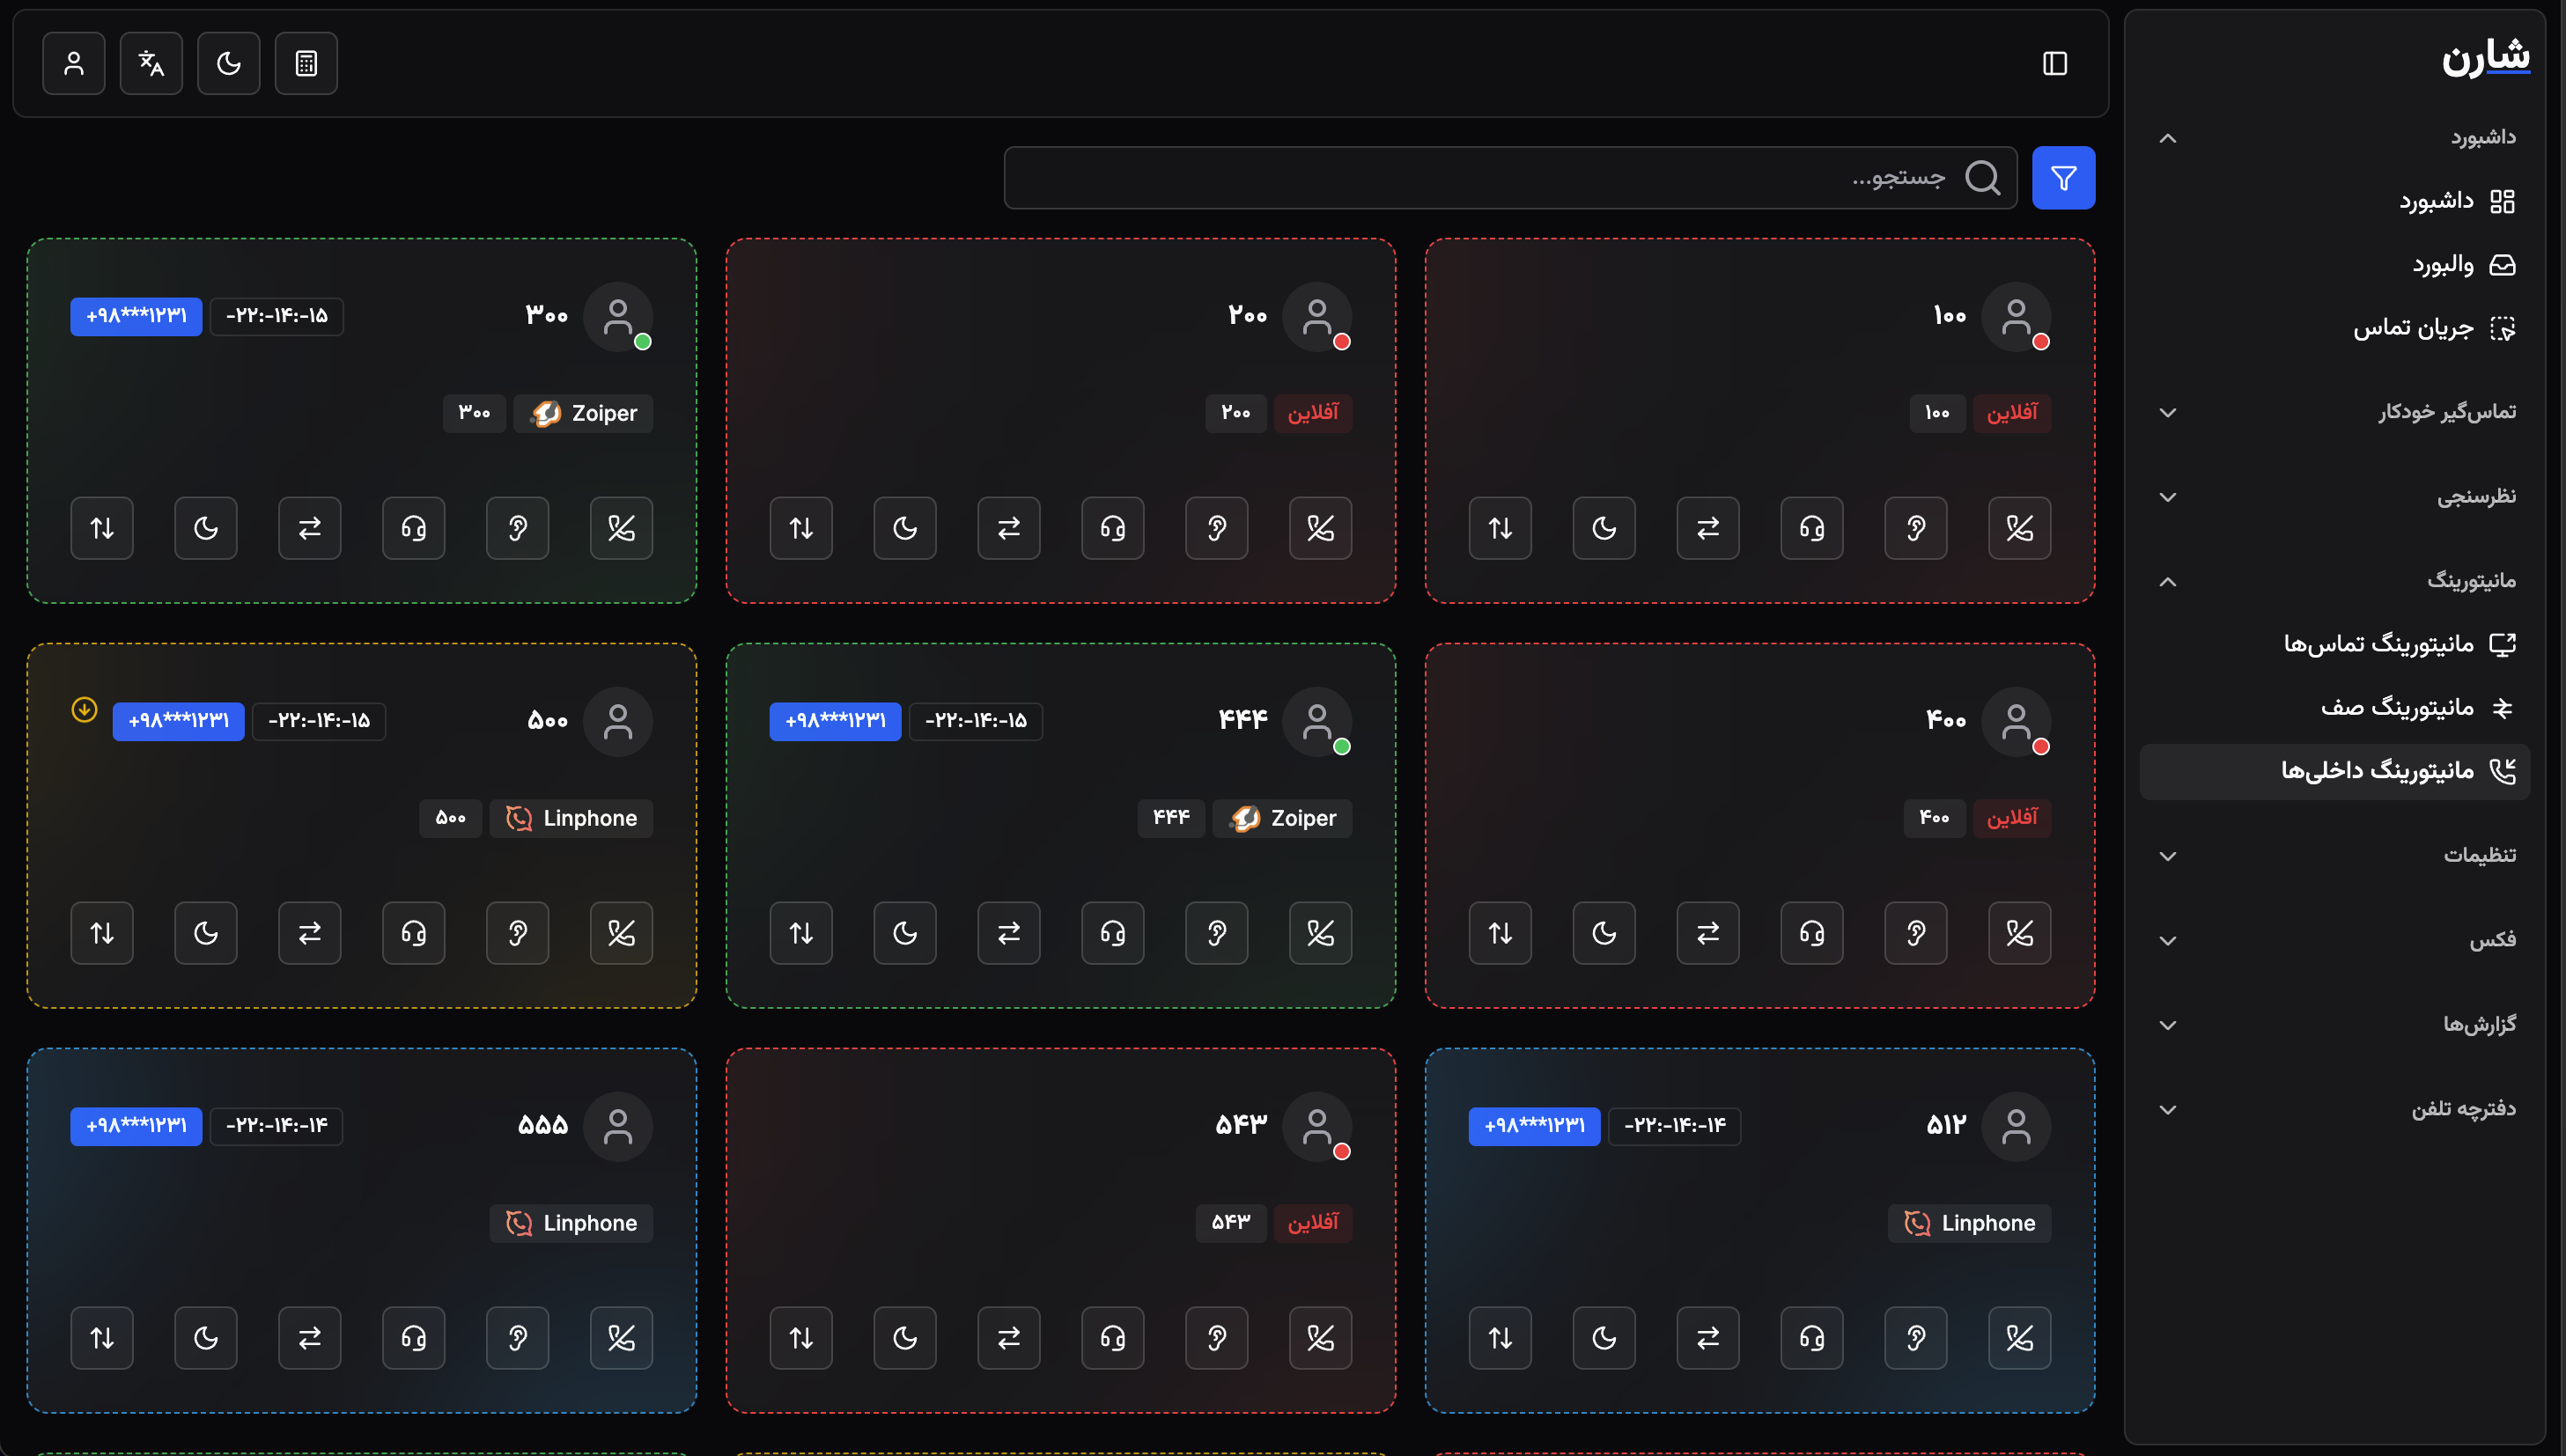
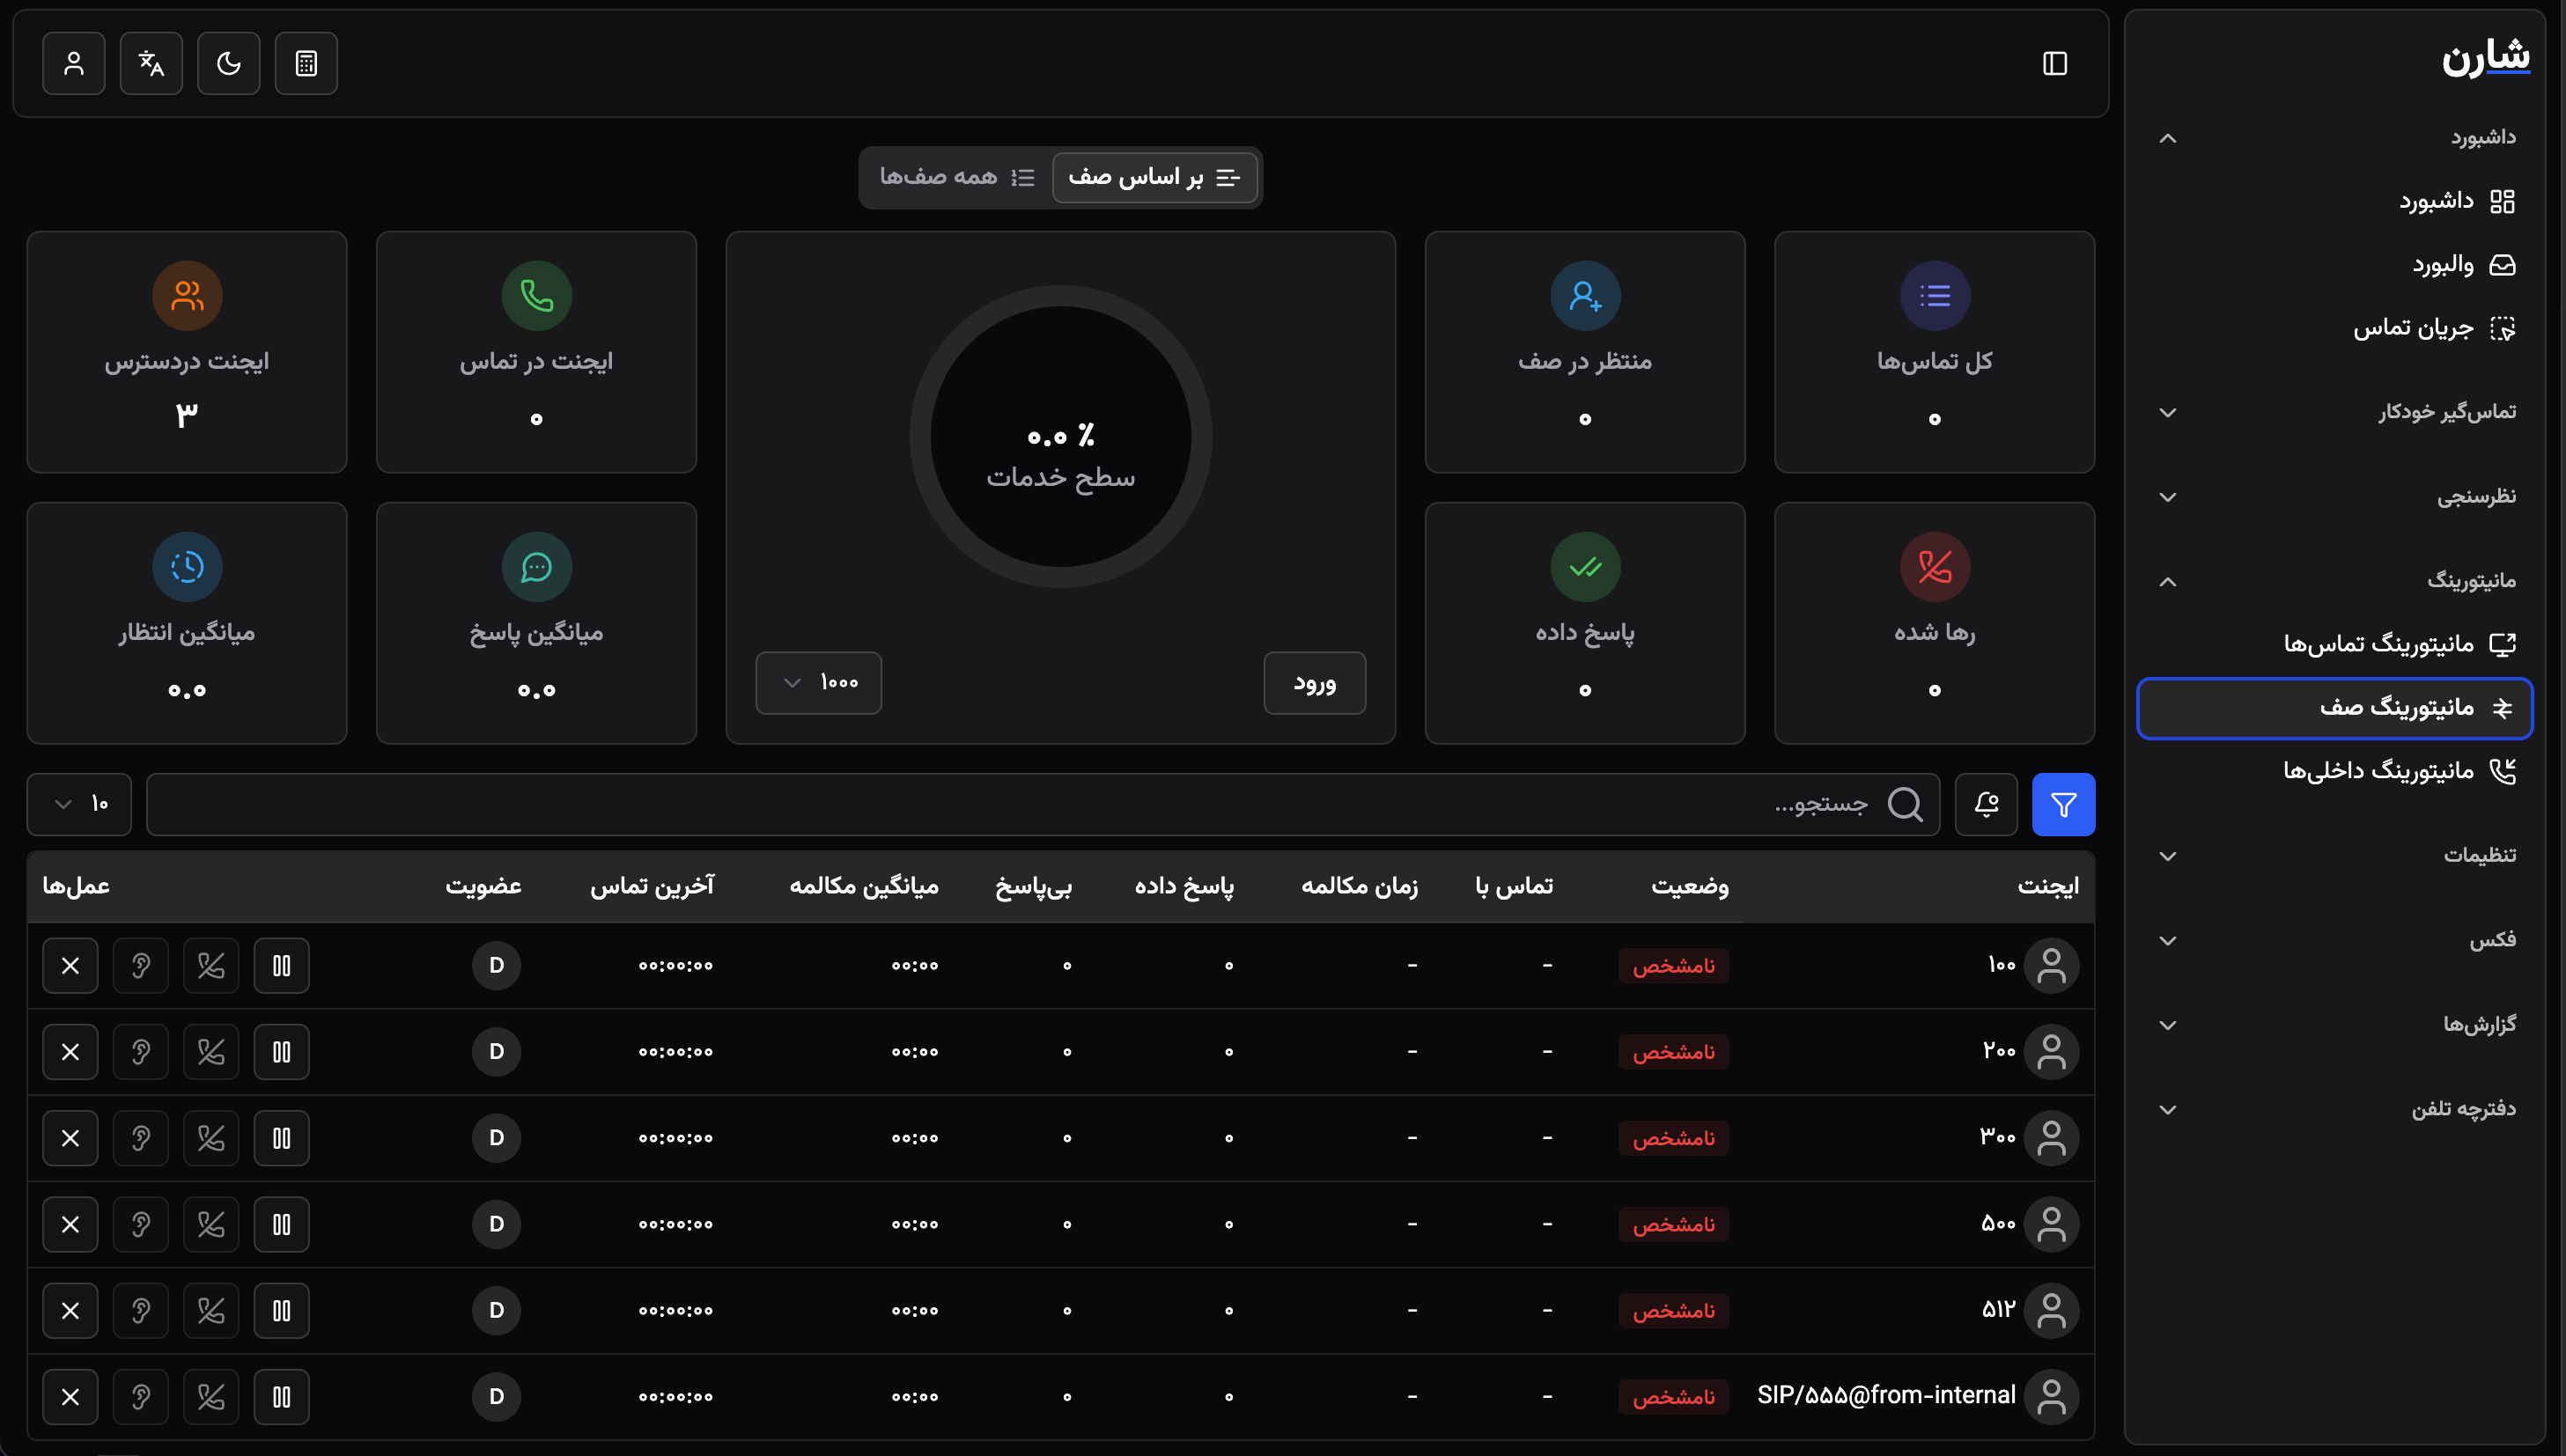
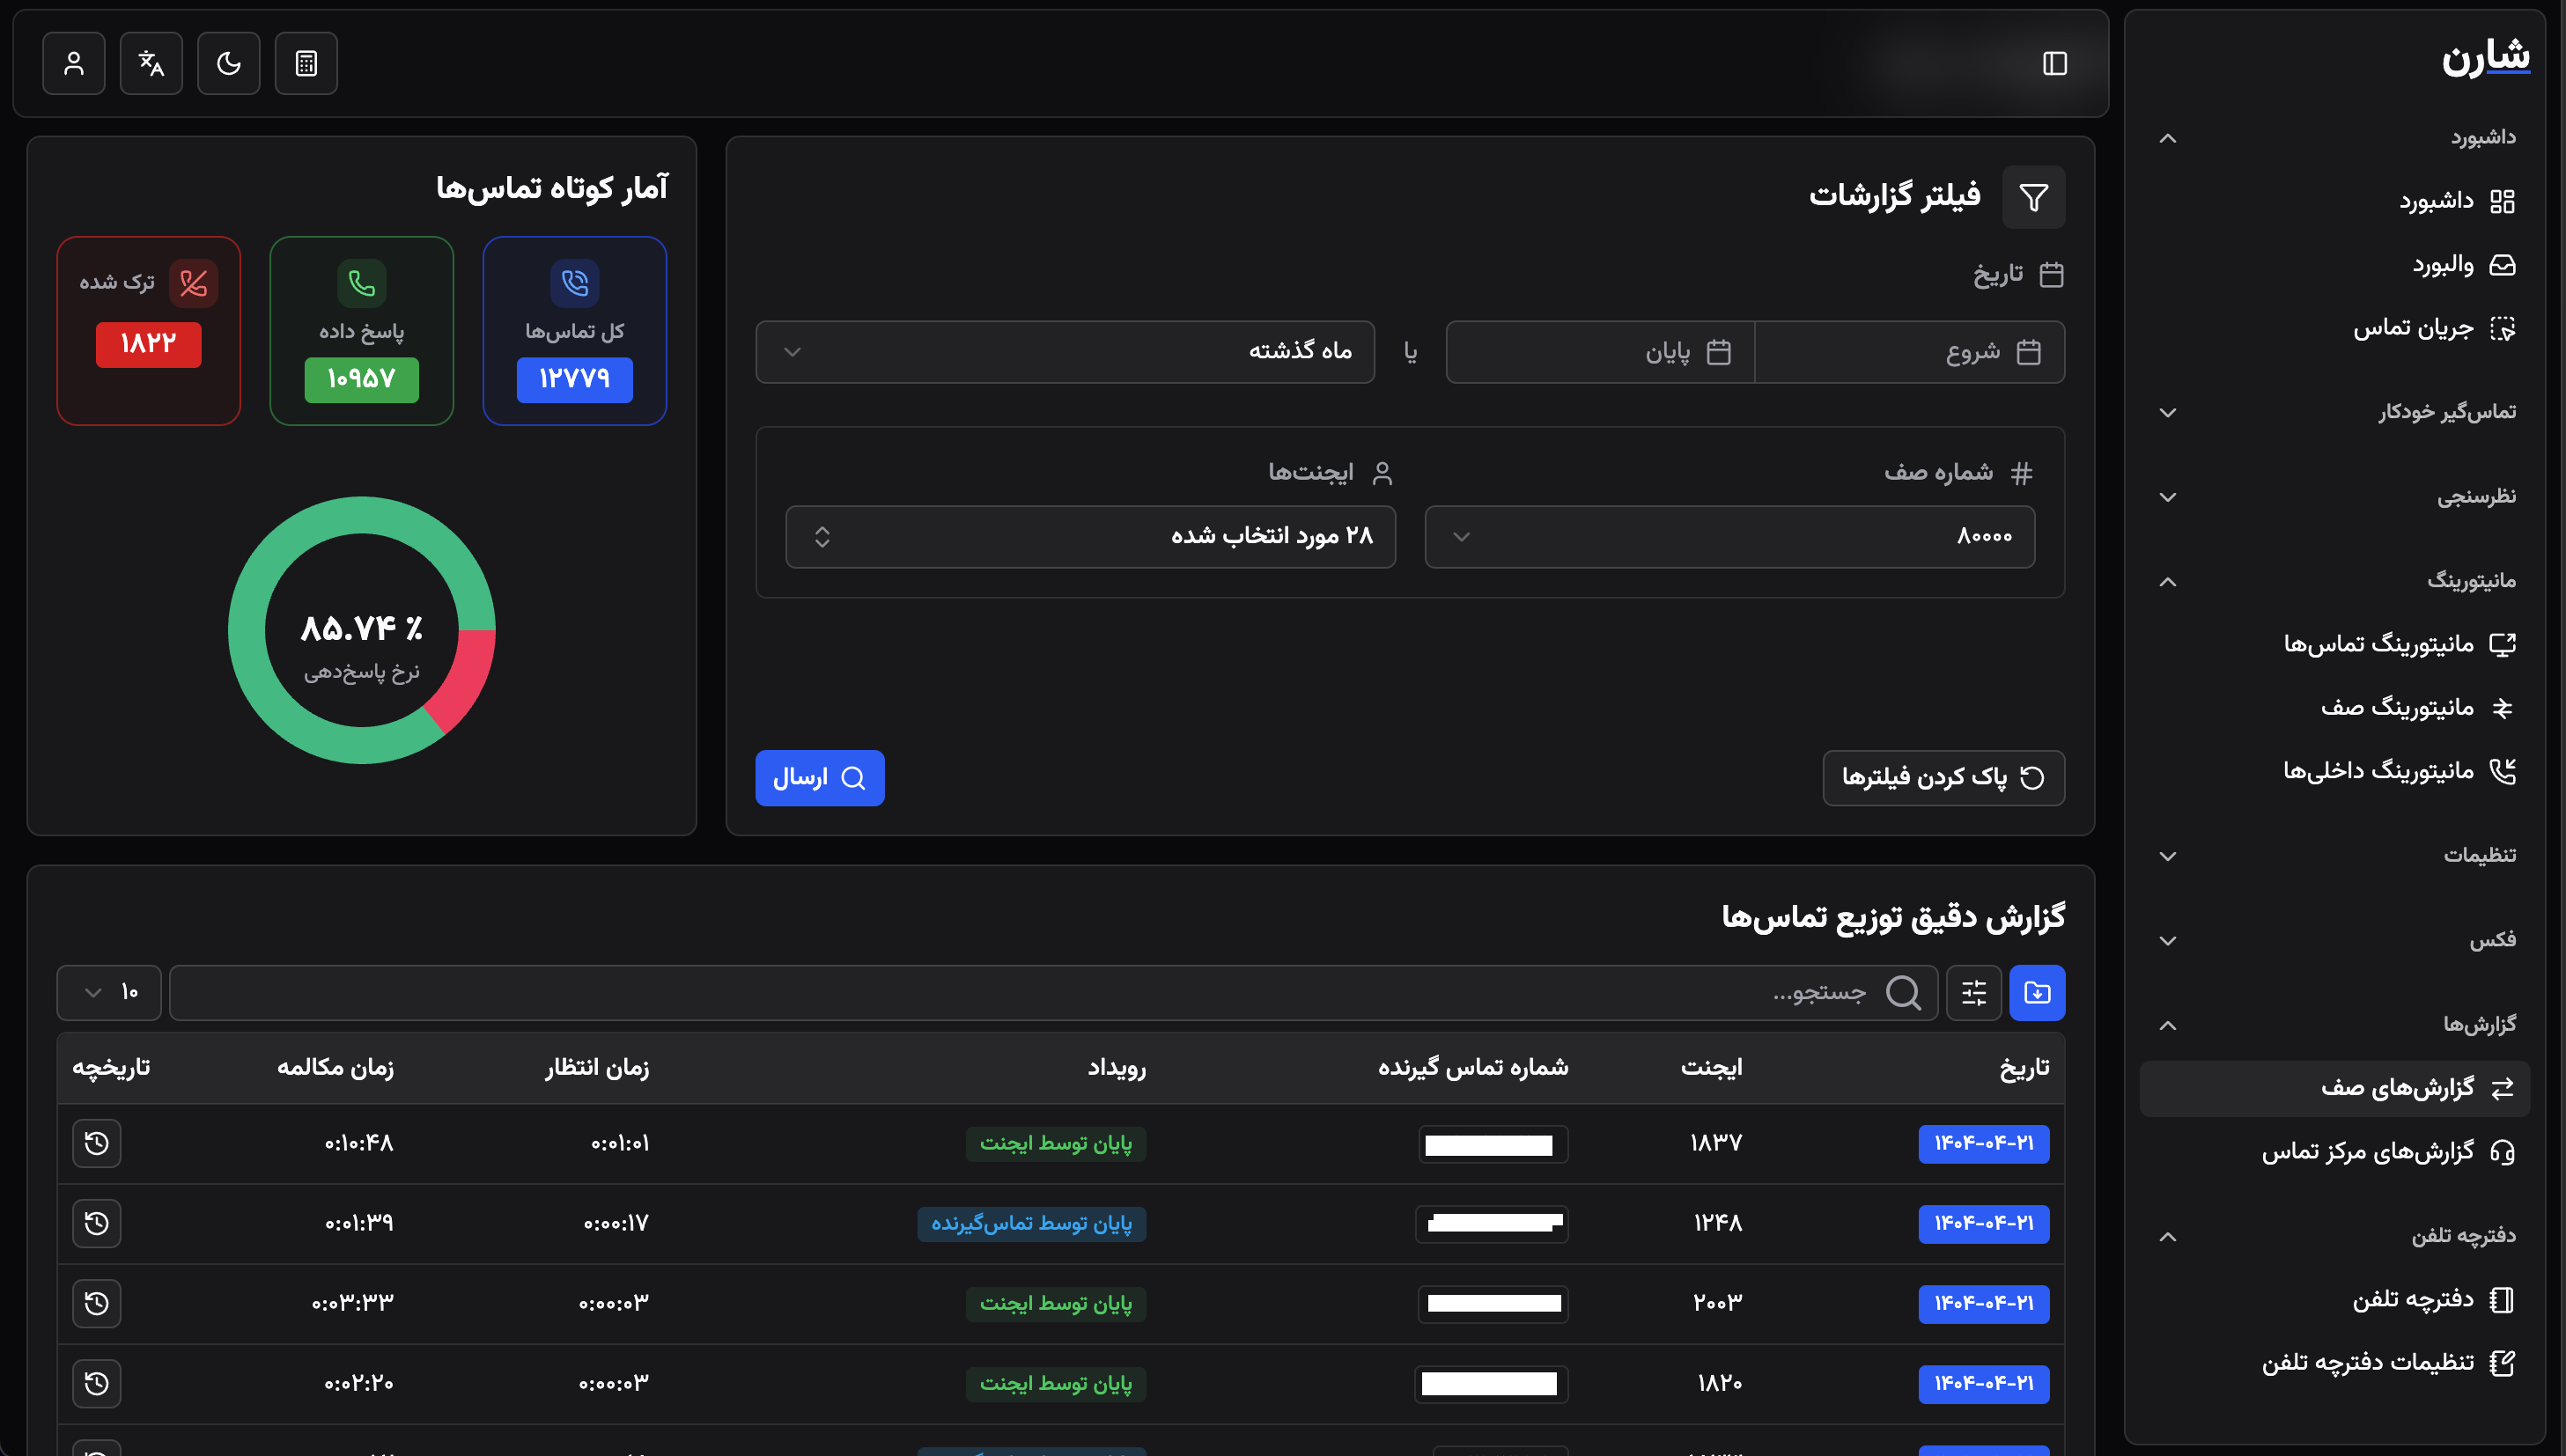
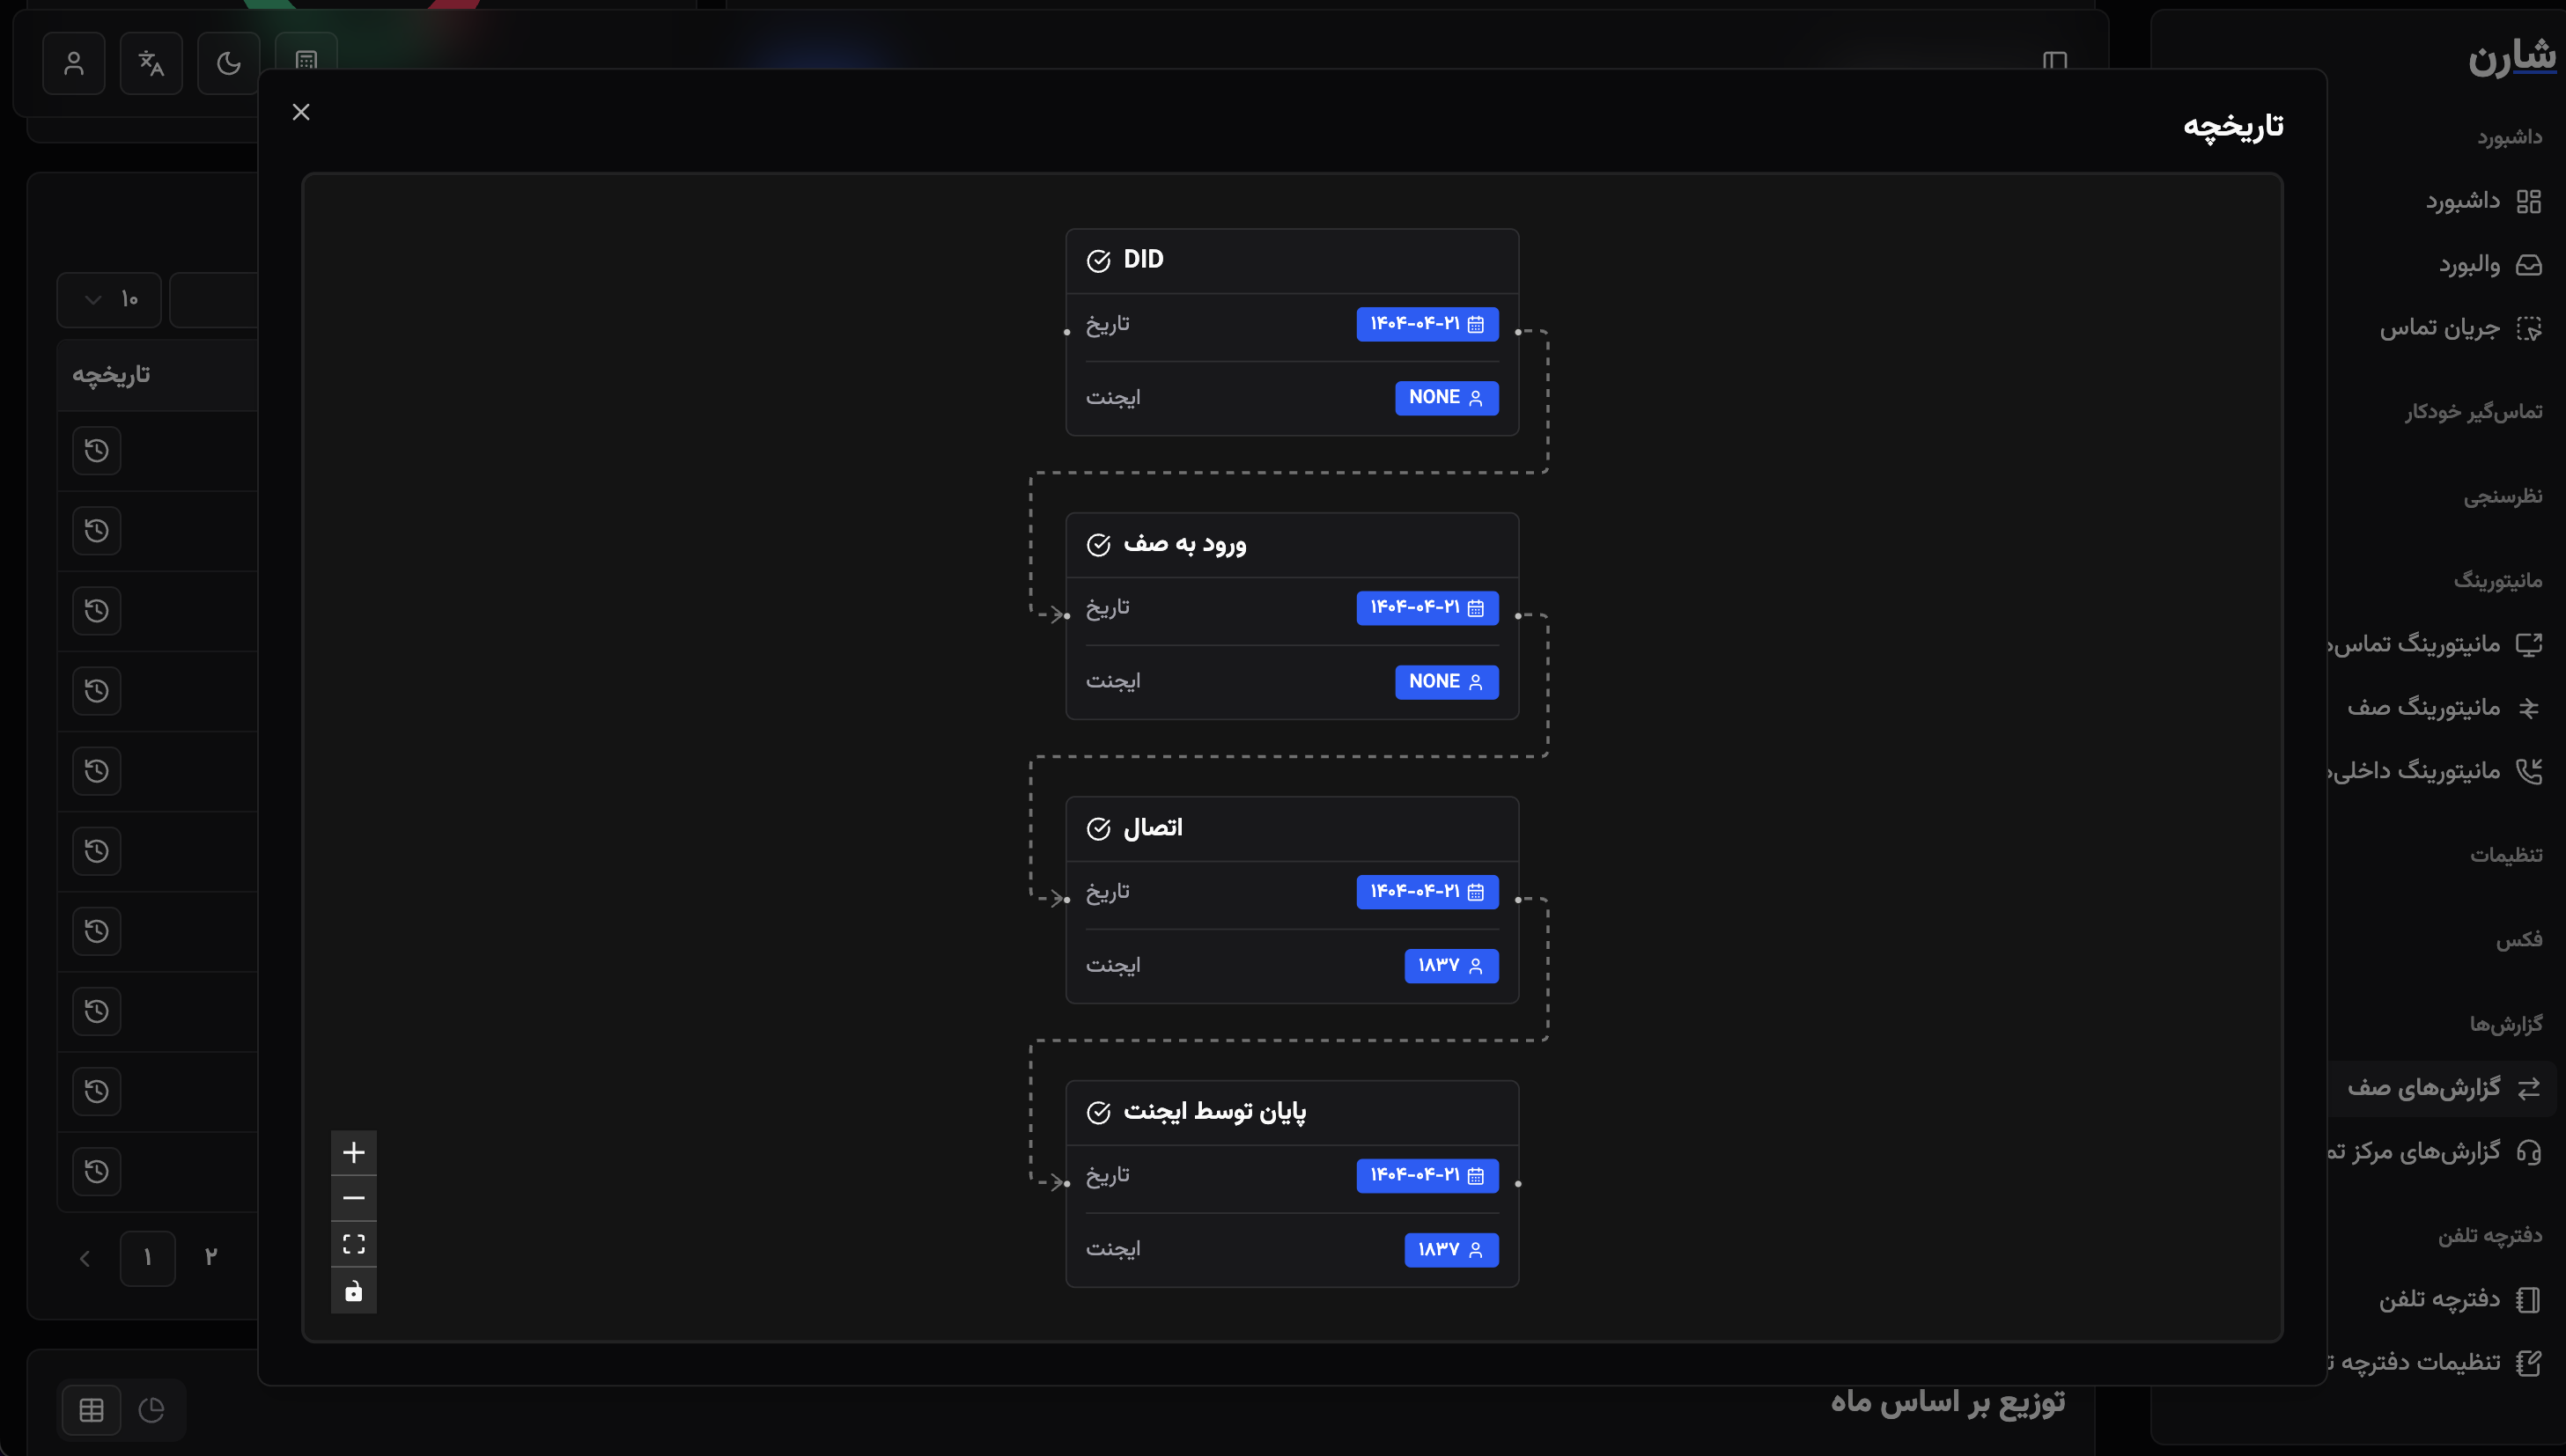
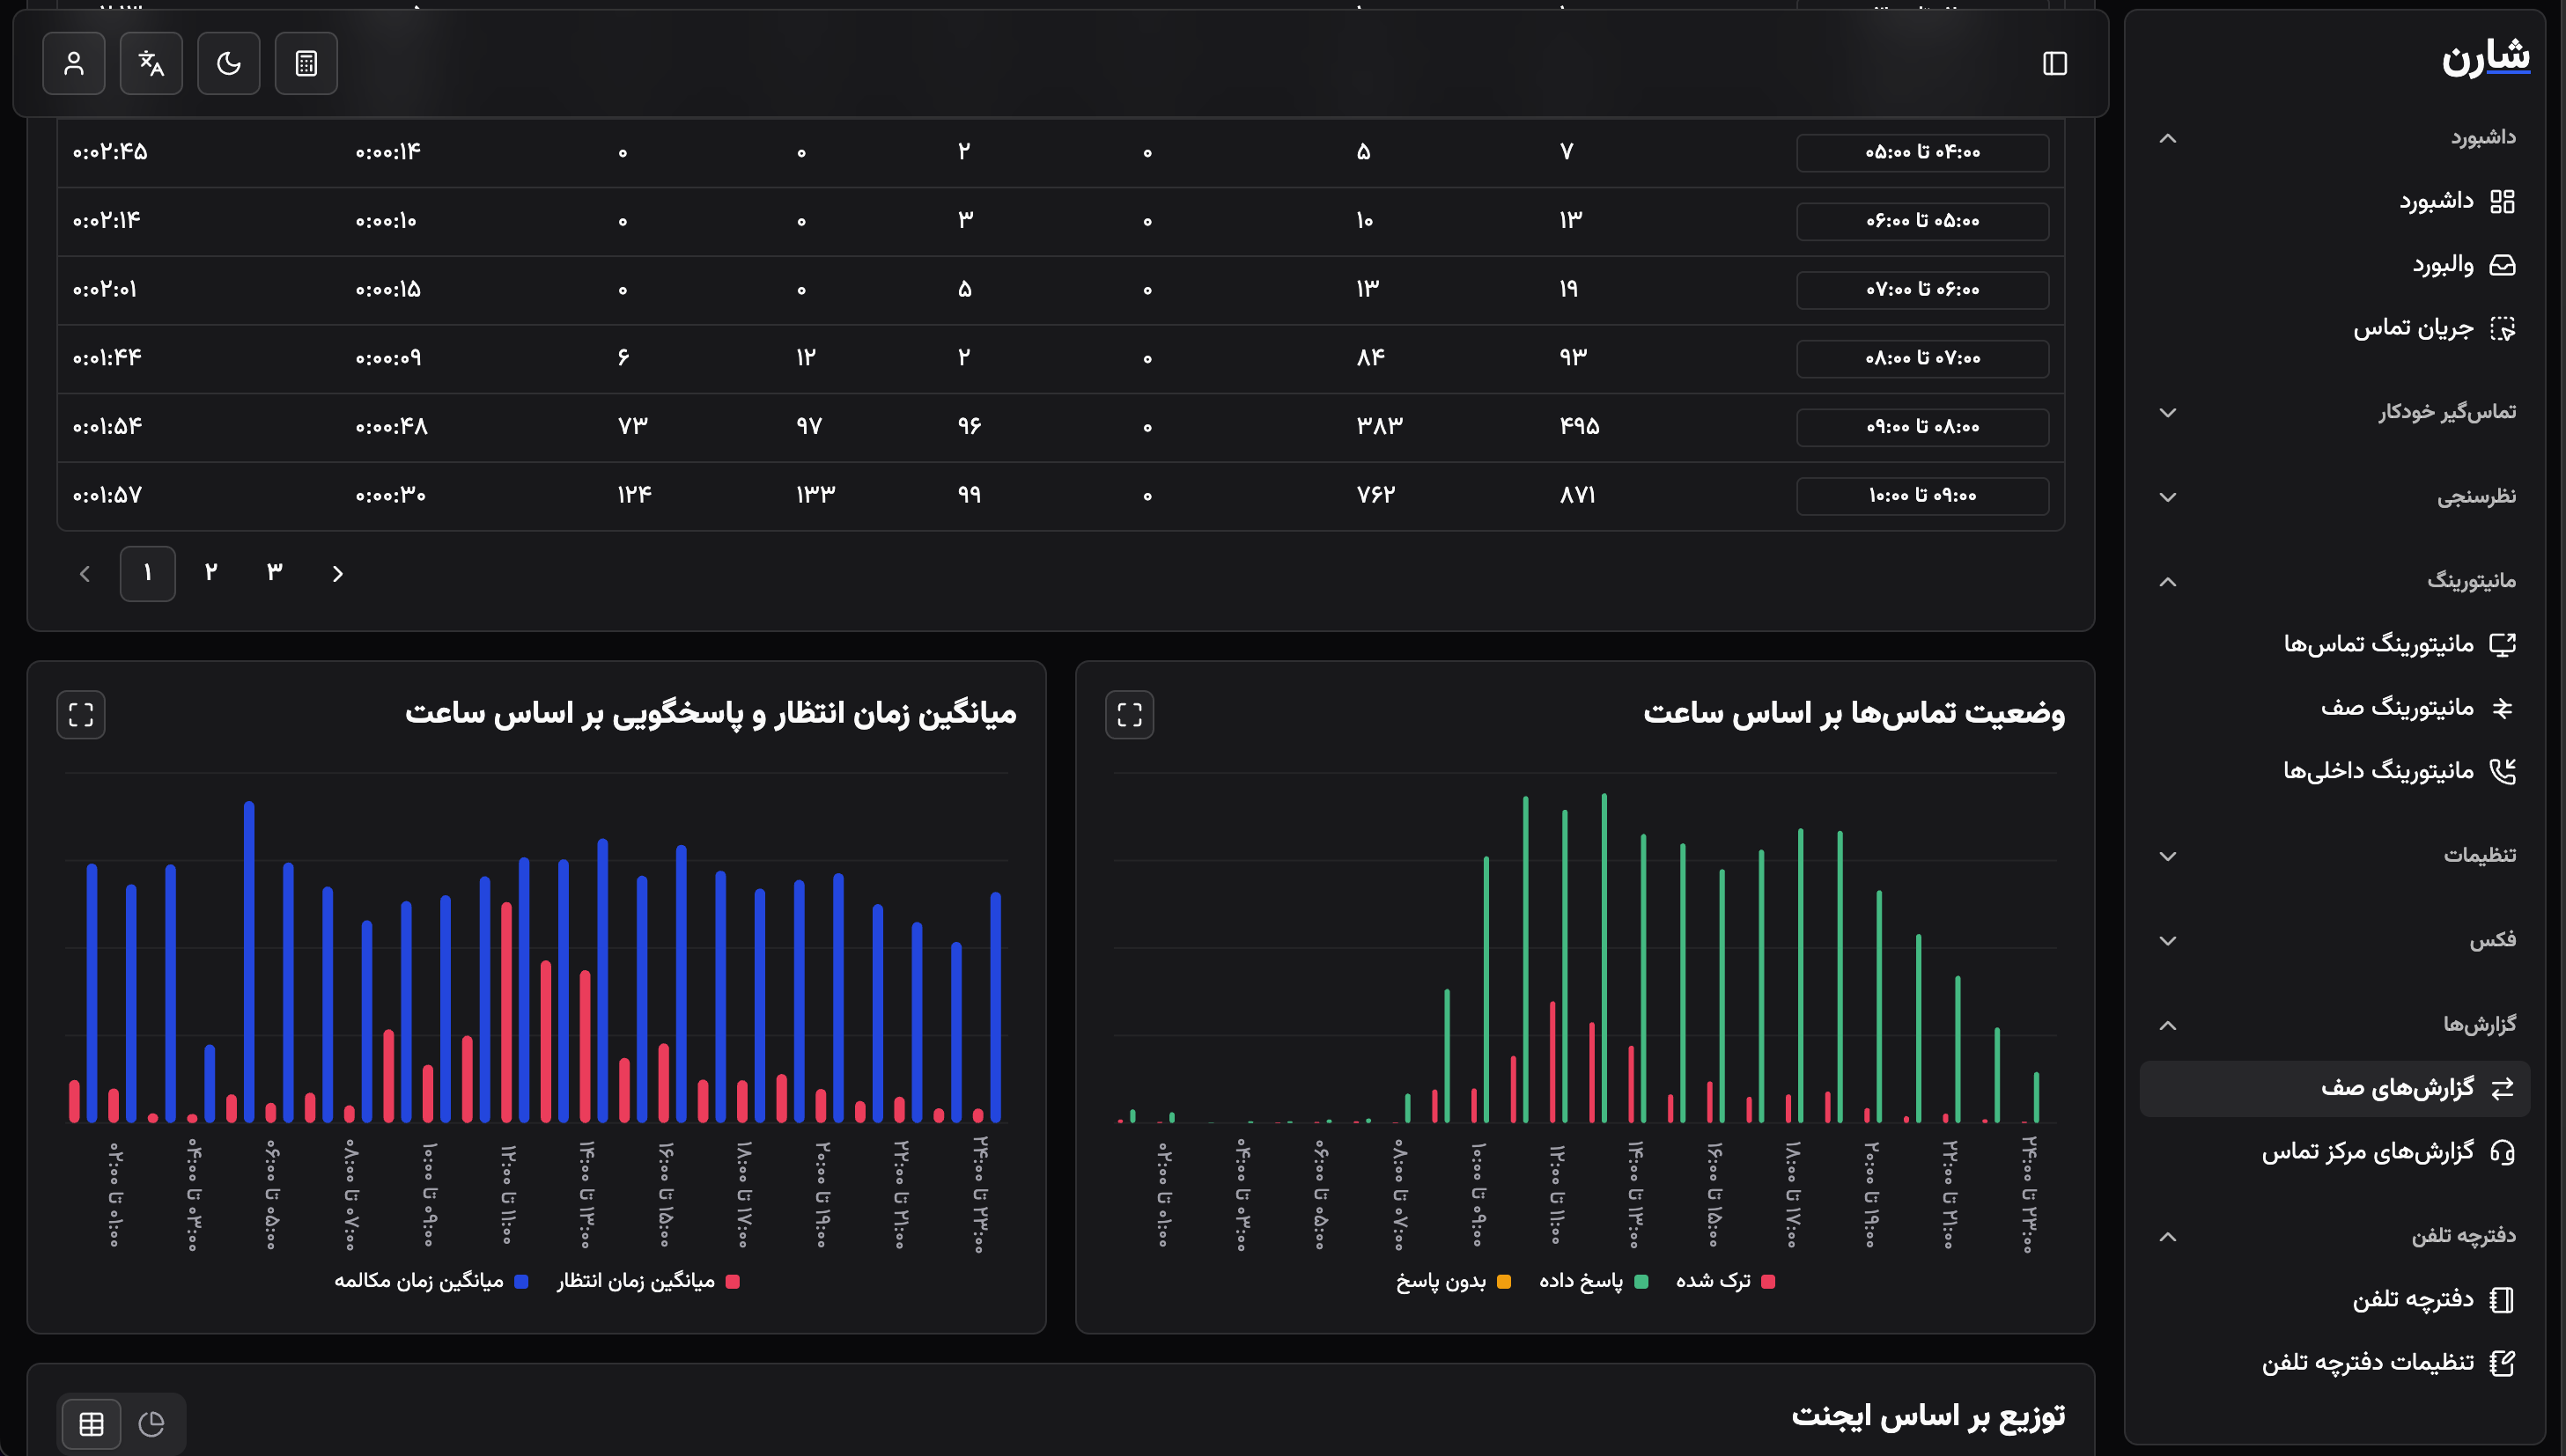
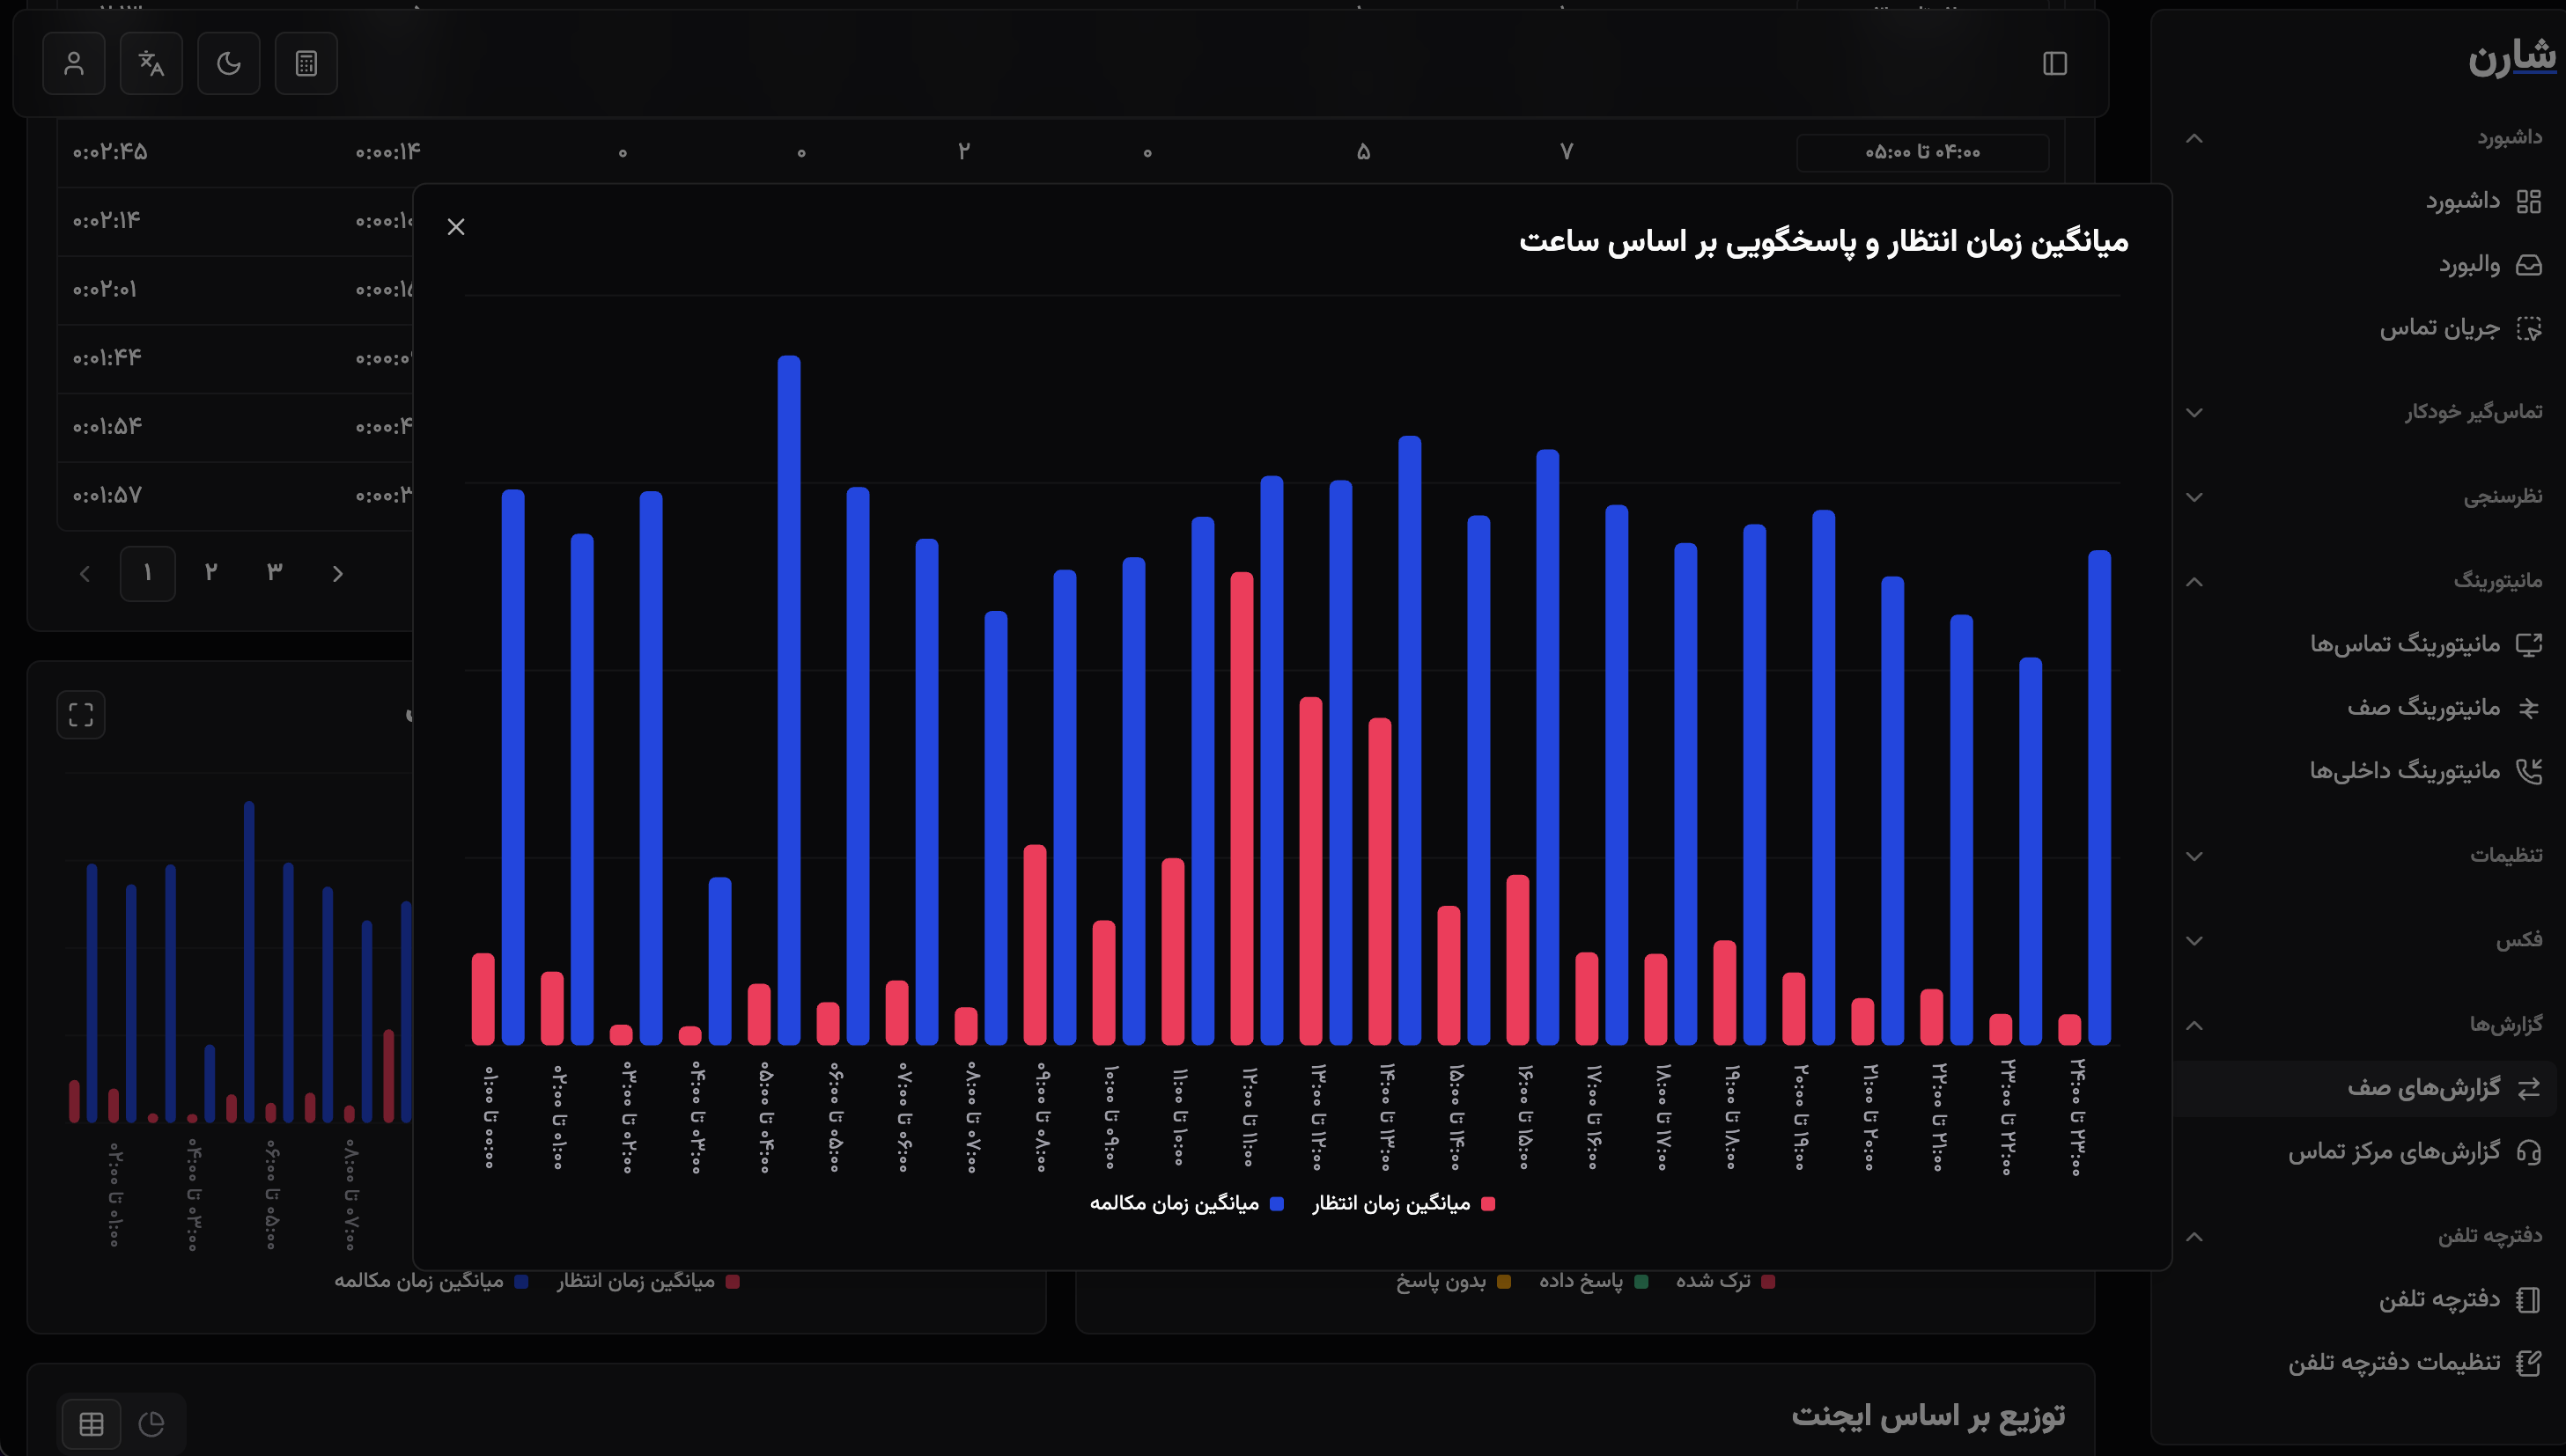
VIOP Monitoring
A dashboard application for monitoring and managing VOIP related features such as calls, extensions, queues, and more. Given the nature of the product and how it’s intended to be sold, I chose to use React (instead of Next.js) and Shadcn UI to ensure a solid design system. I was also fully responsible for the app’s UI and UX, so I read the book *Refactoring UI* by the creators of Tailwind CSS, which helped me greatly improve my design thinking.API calls and caching
Optimizing large lists
Implementing real-time features
Choosing the best technologies for each task
UI & UX design
UI & UX fundamentals
Importance of design systems
Virtual rendering
Handling large datasets
Jira
React Flow
This was my first real experience working as a front-end developer on a team. I learned a lot during this time. not just from the work itself, but also from pushing myself to stay updated with modern technologies, even though it wasn't required. I eventually left the company because I wanted to work on more modern products that follow best practices and use cutting-edge technologies.
Projects
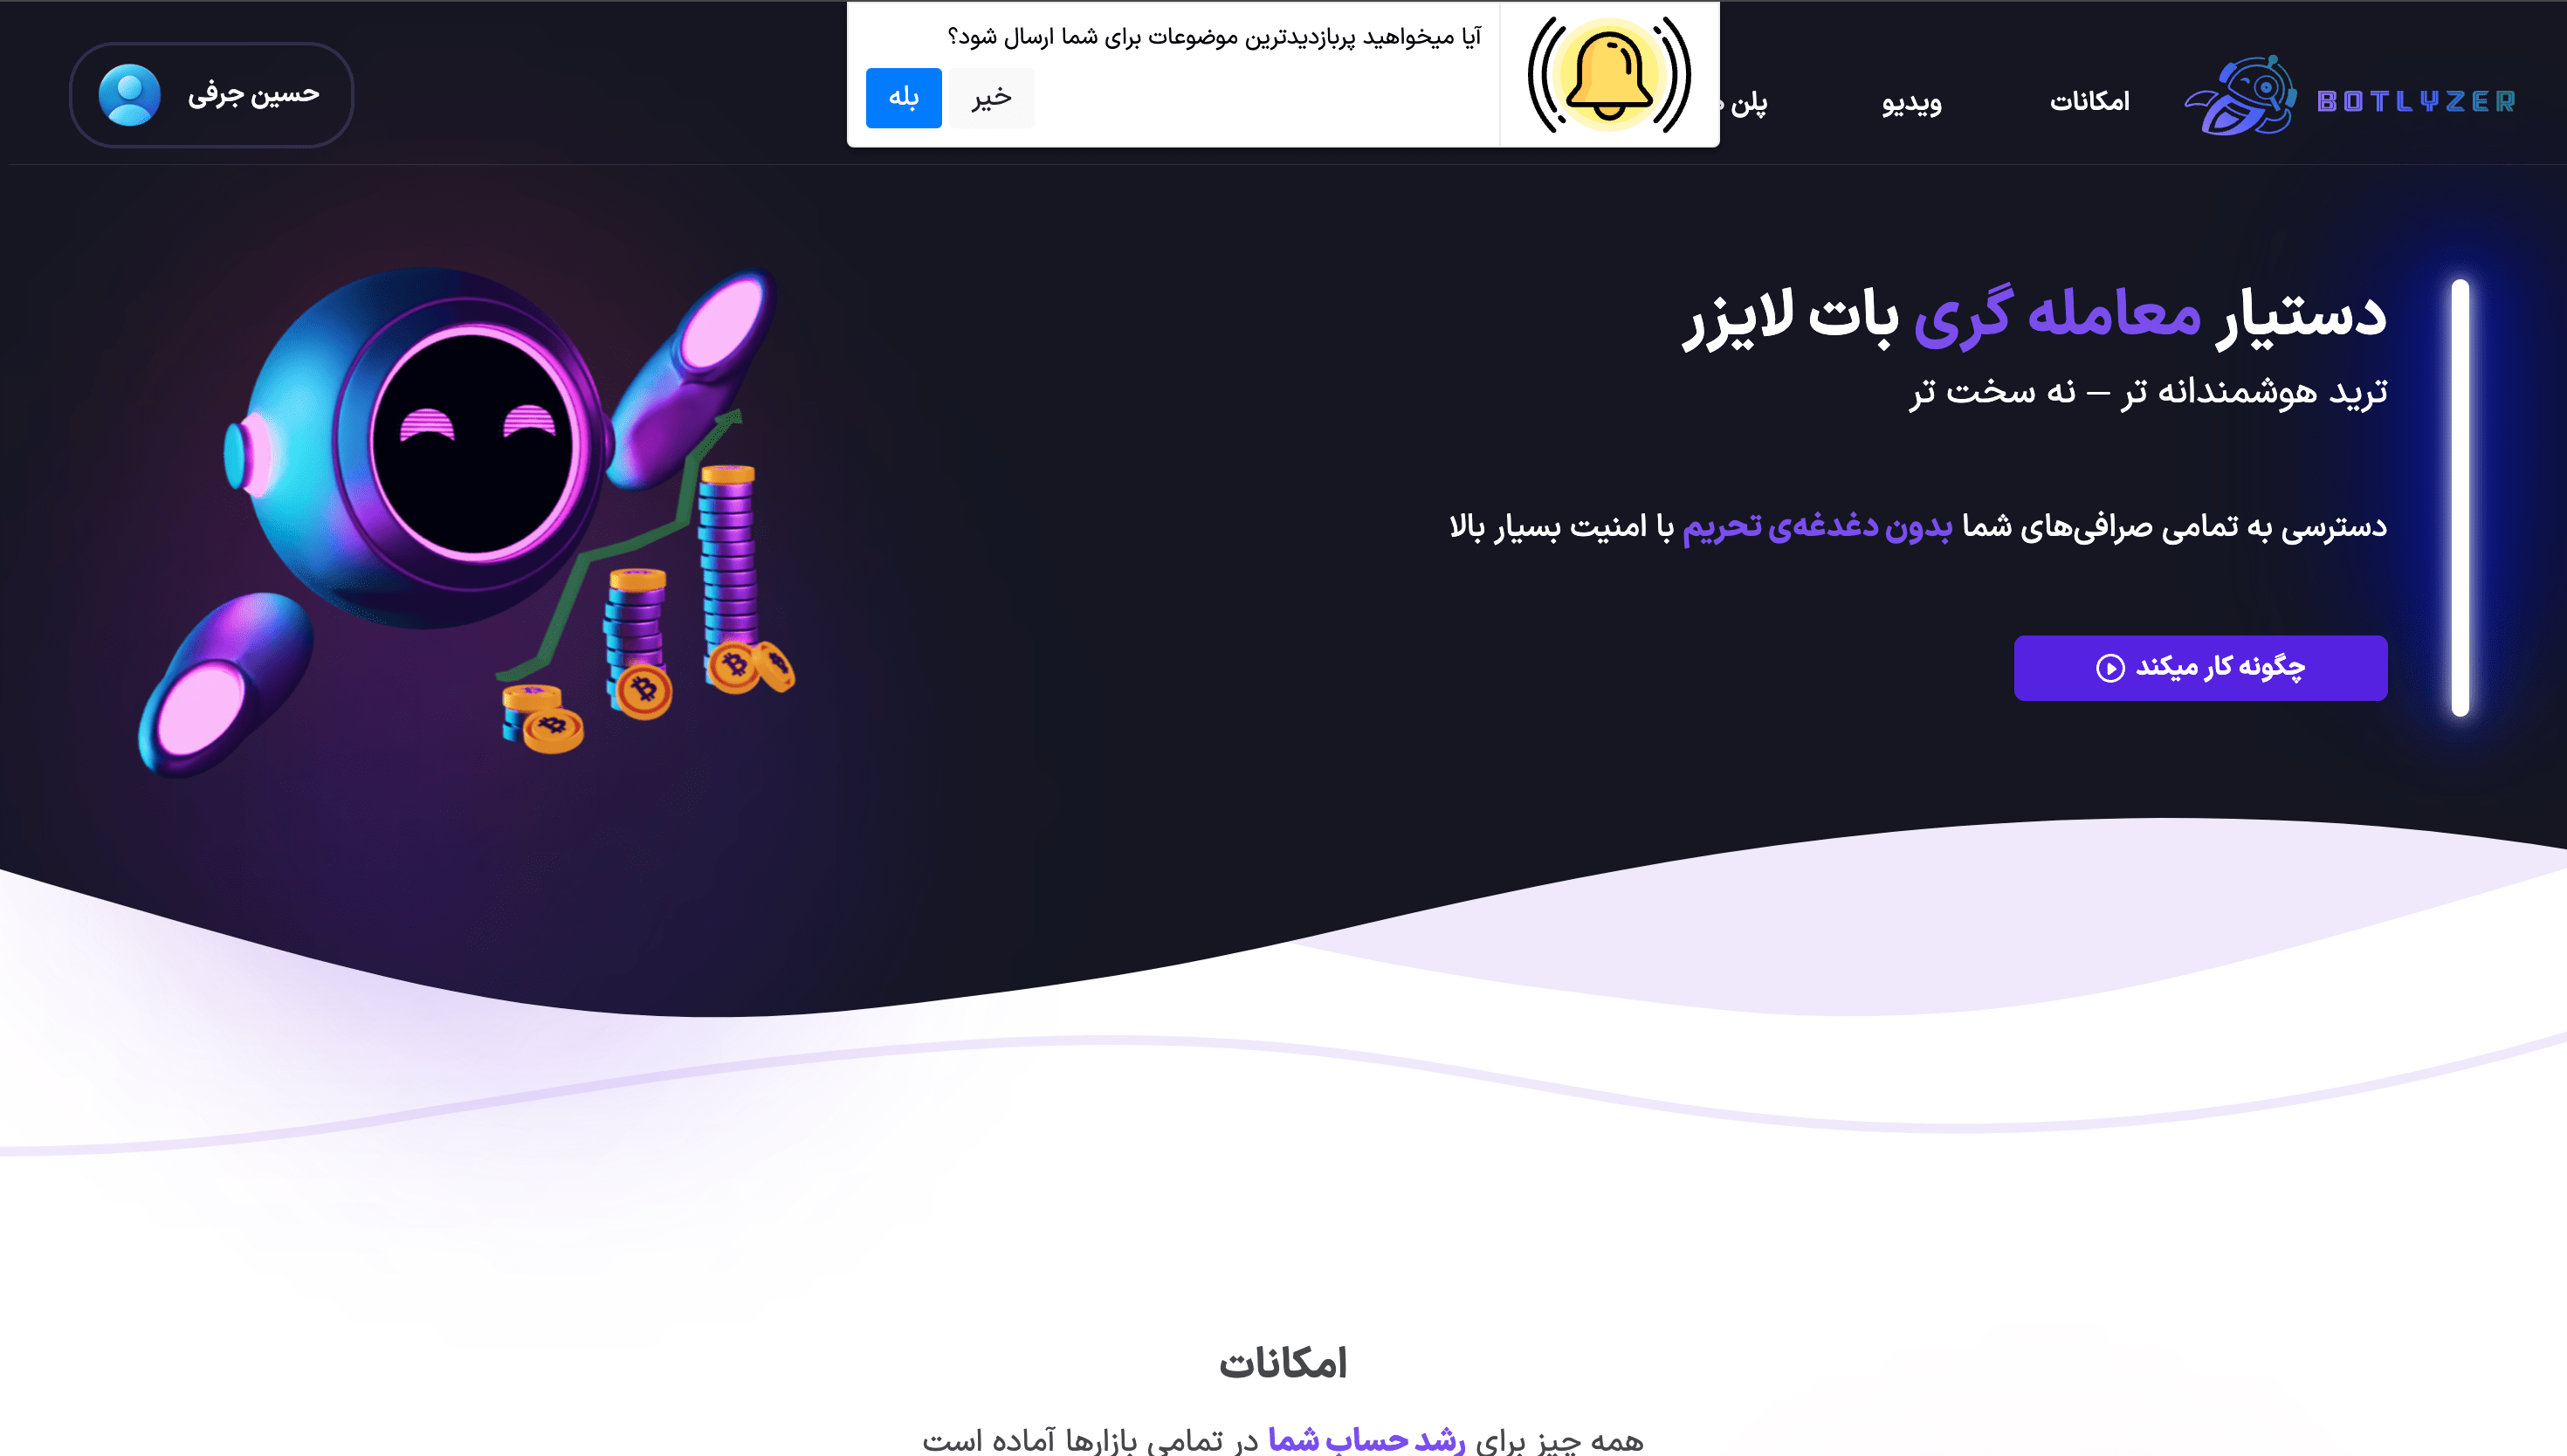
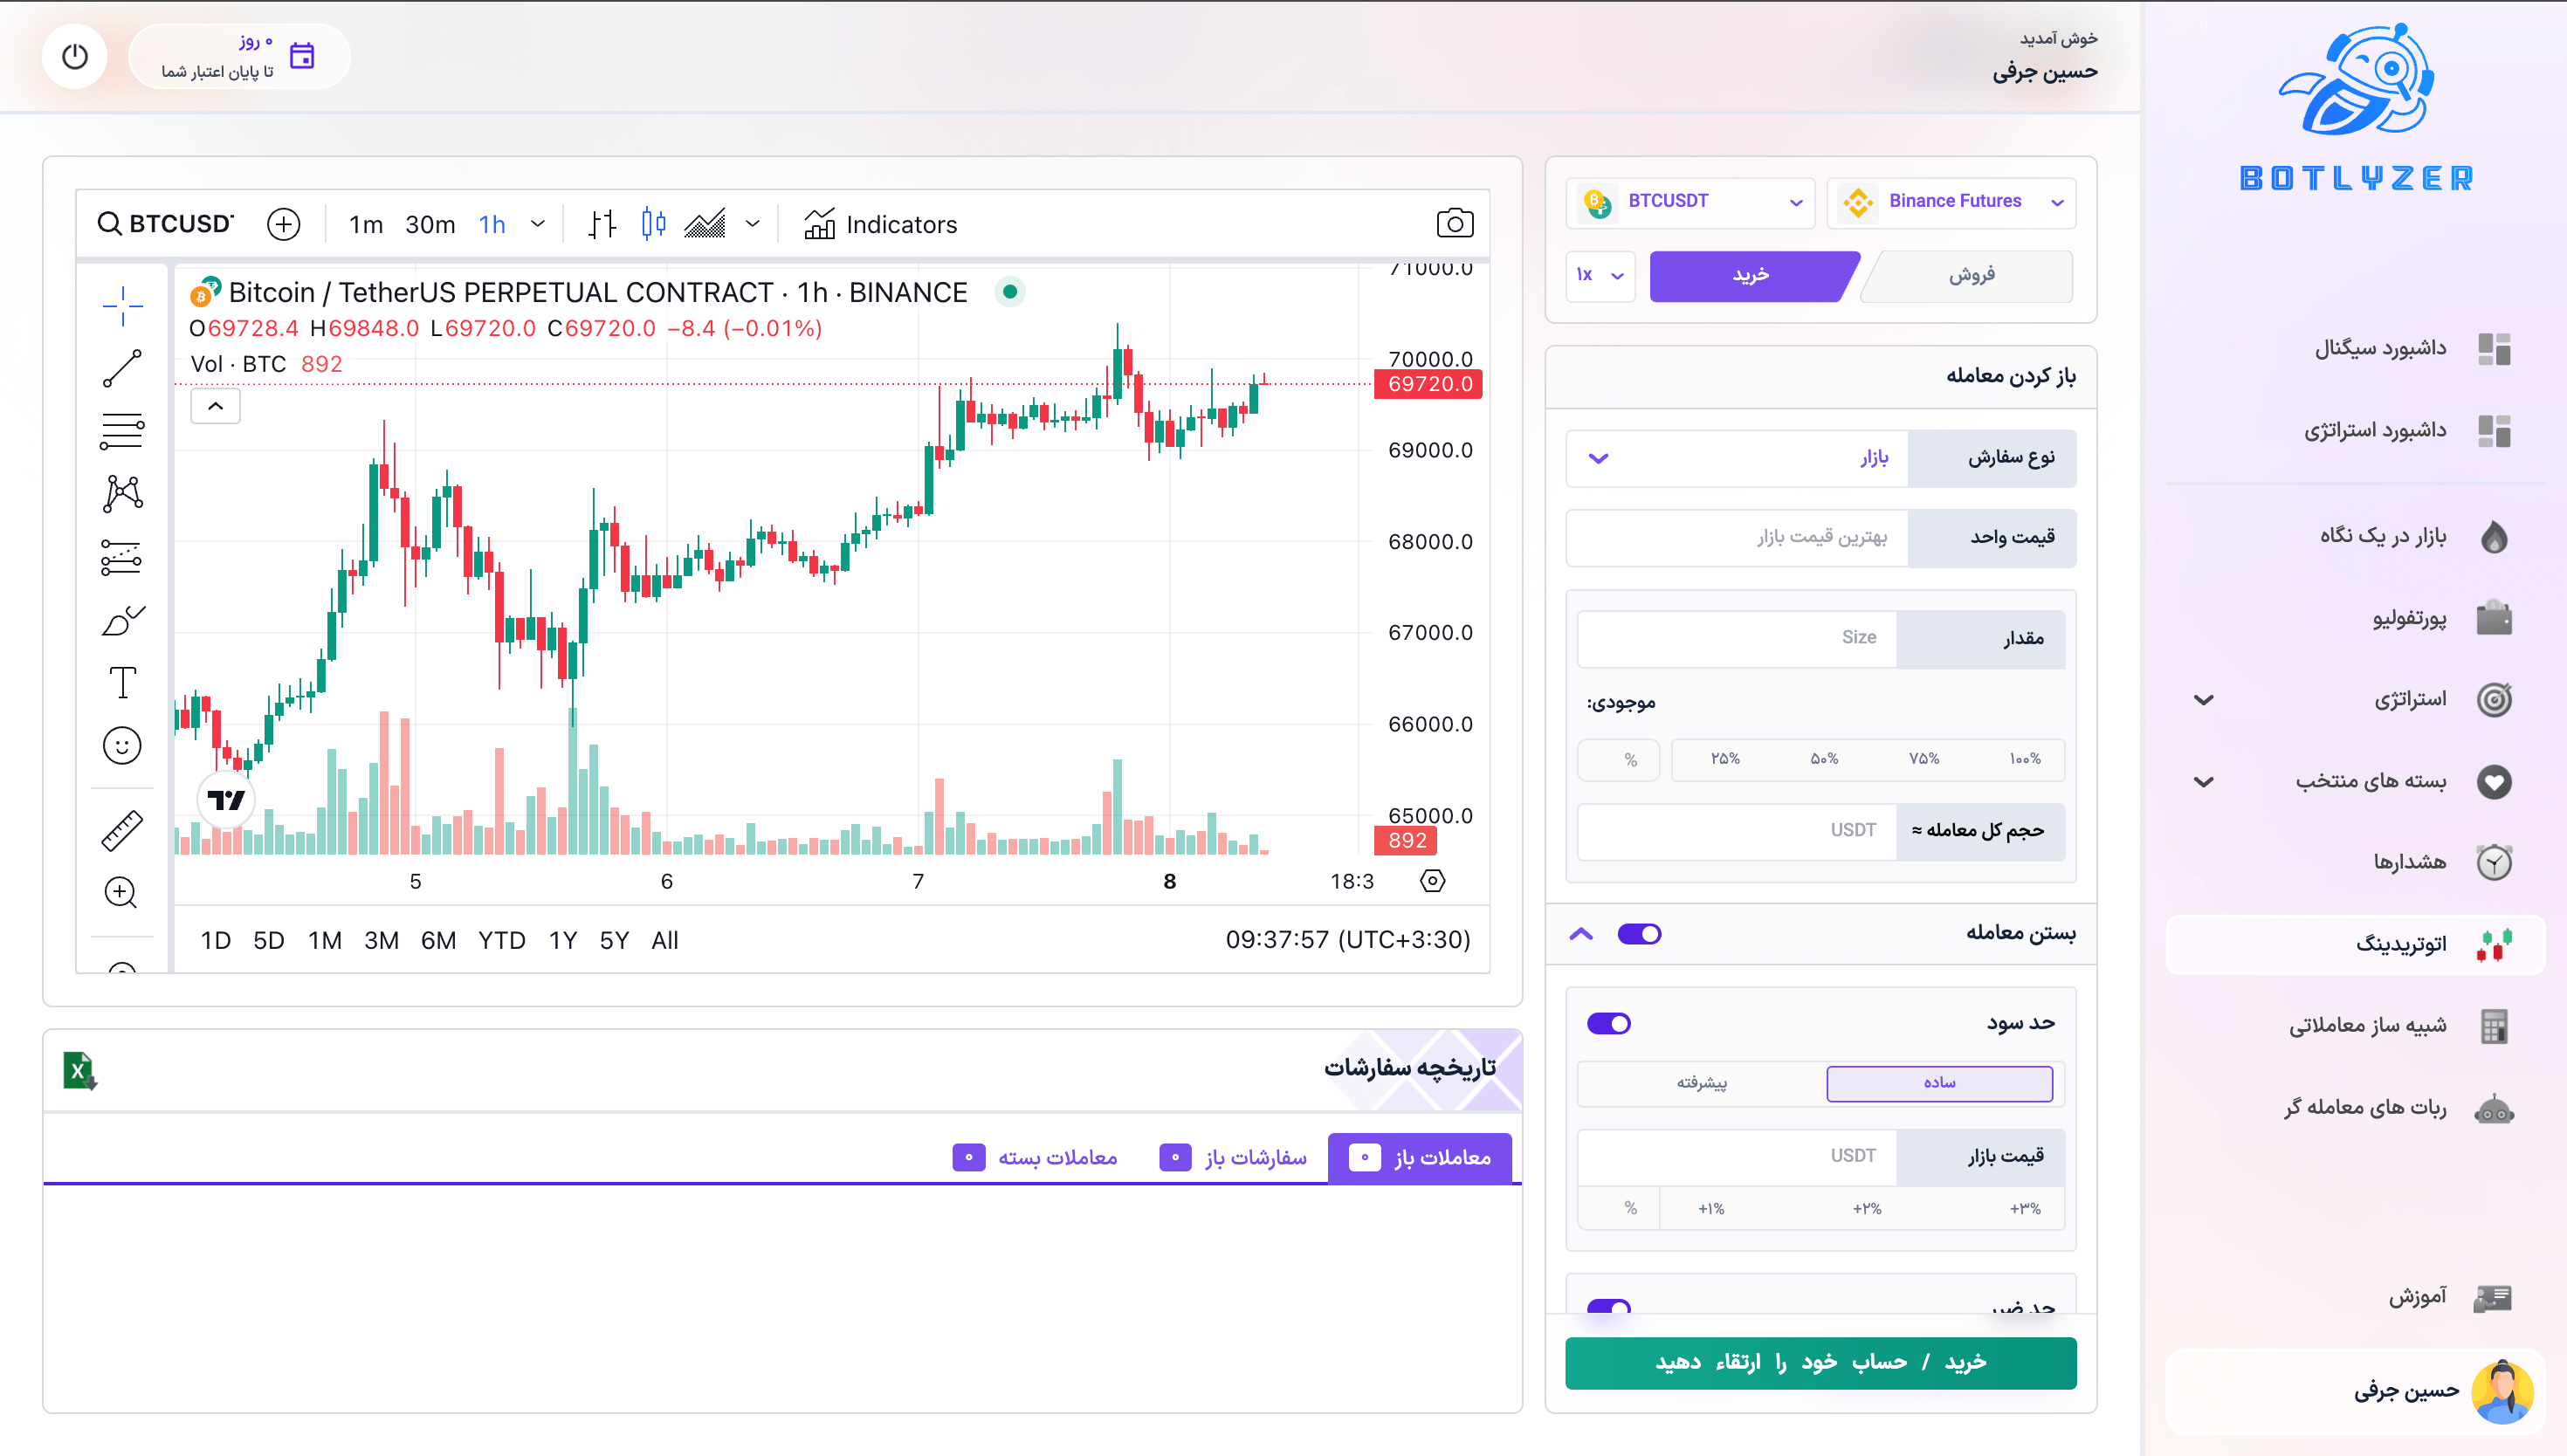
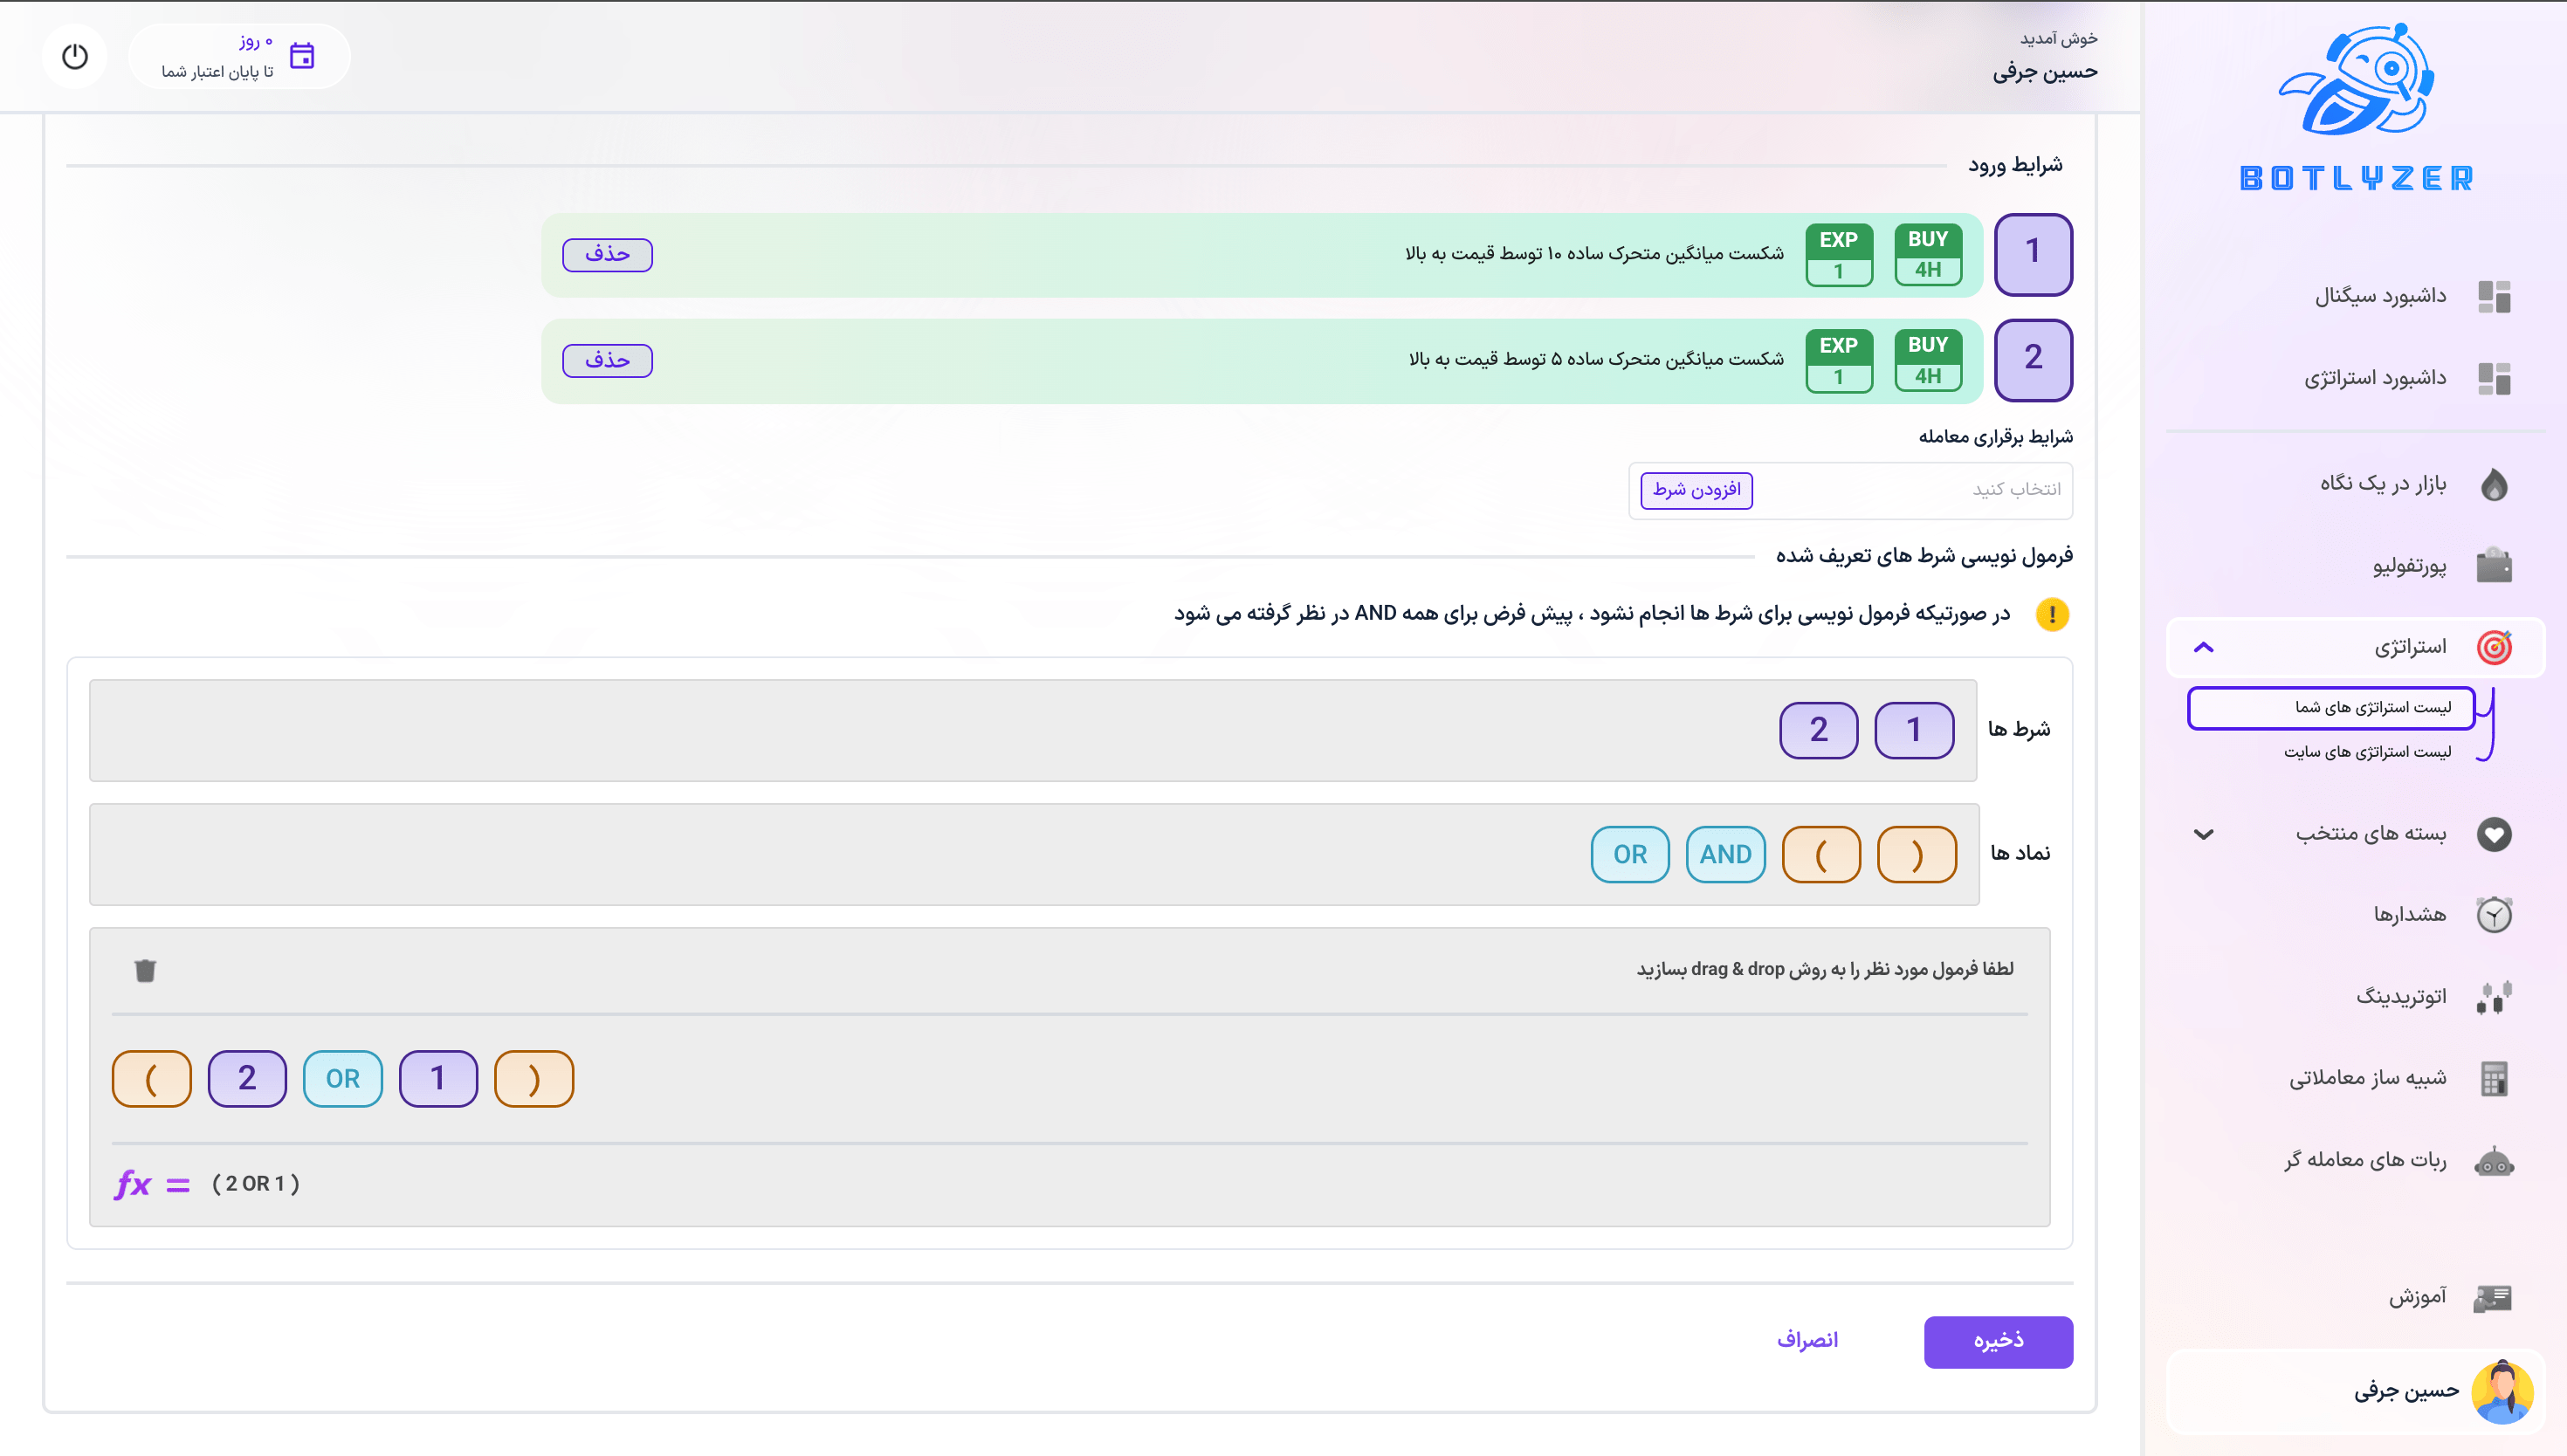
Botlyzer
A cryptocurrency platform where users can connect their exchange API keys to manage all their exchanges in one place. The app offers features such as asset management, advanced trading (with stop-loss and take-profit), strategy creation using programmable logic, and full integration with TradingView charts.App logic development
API integration
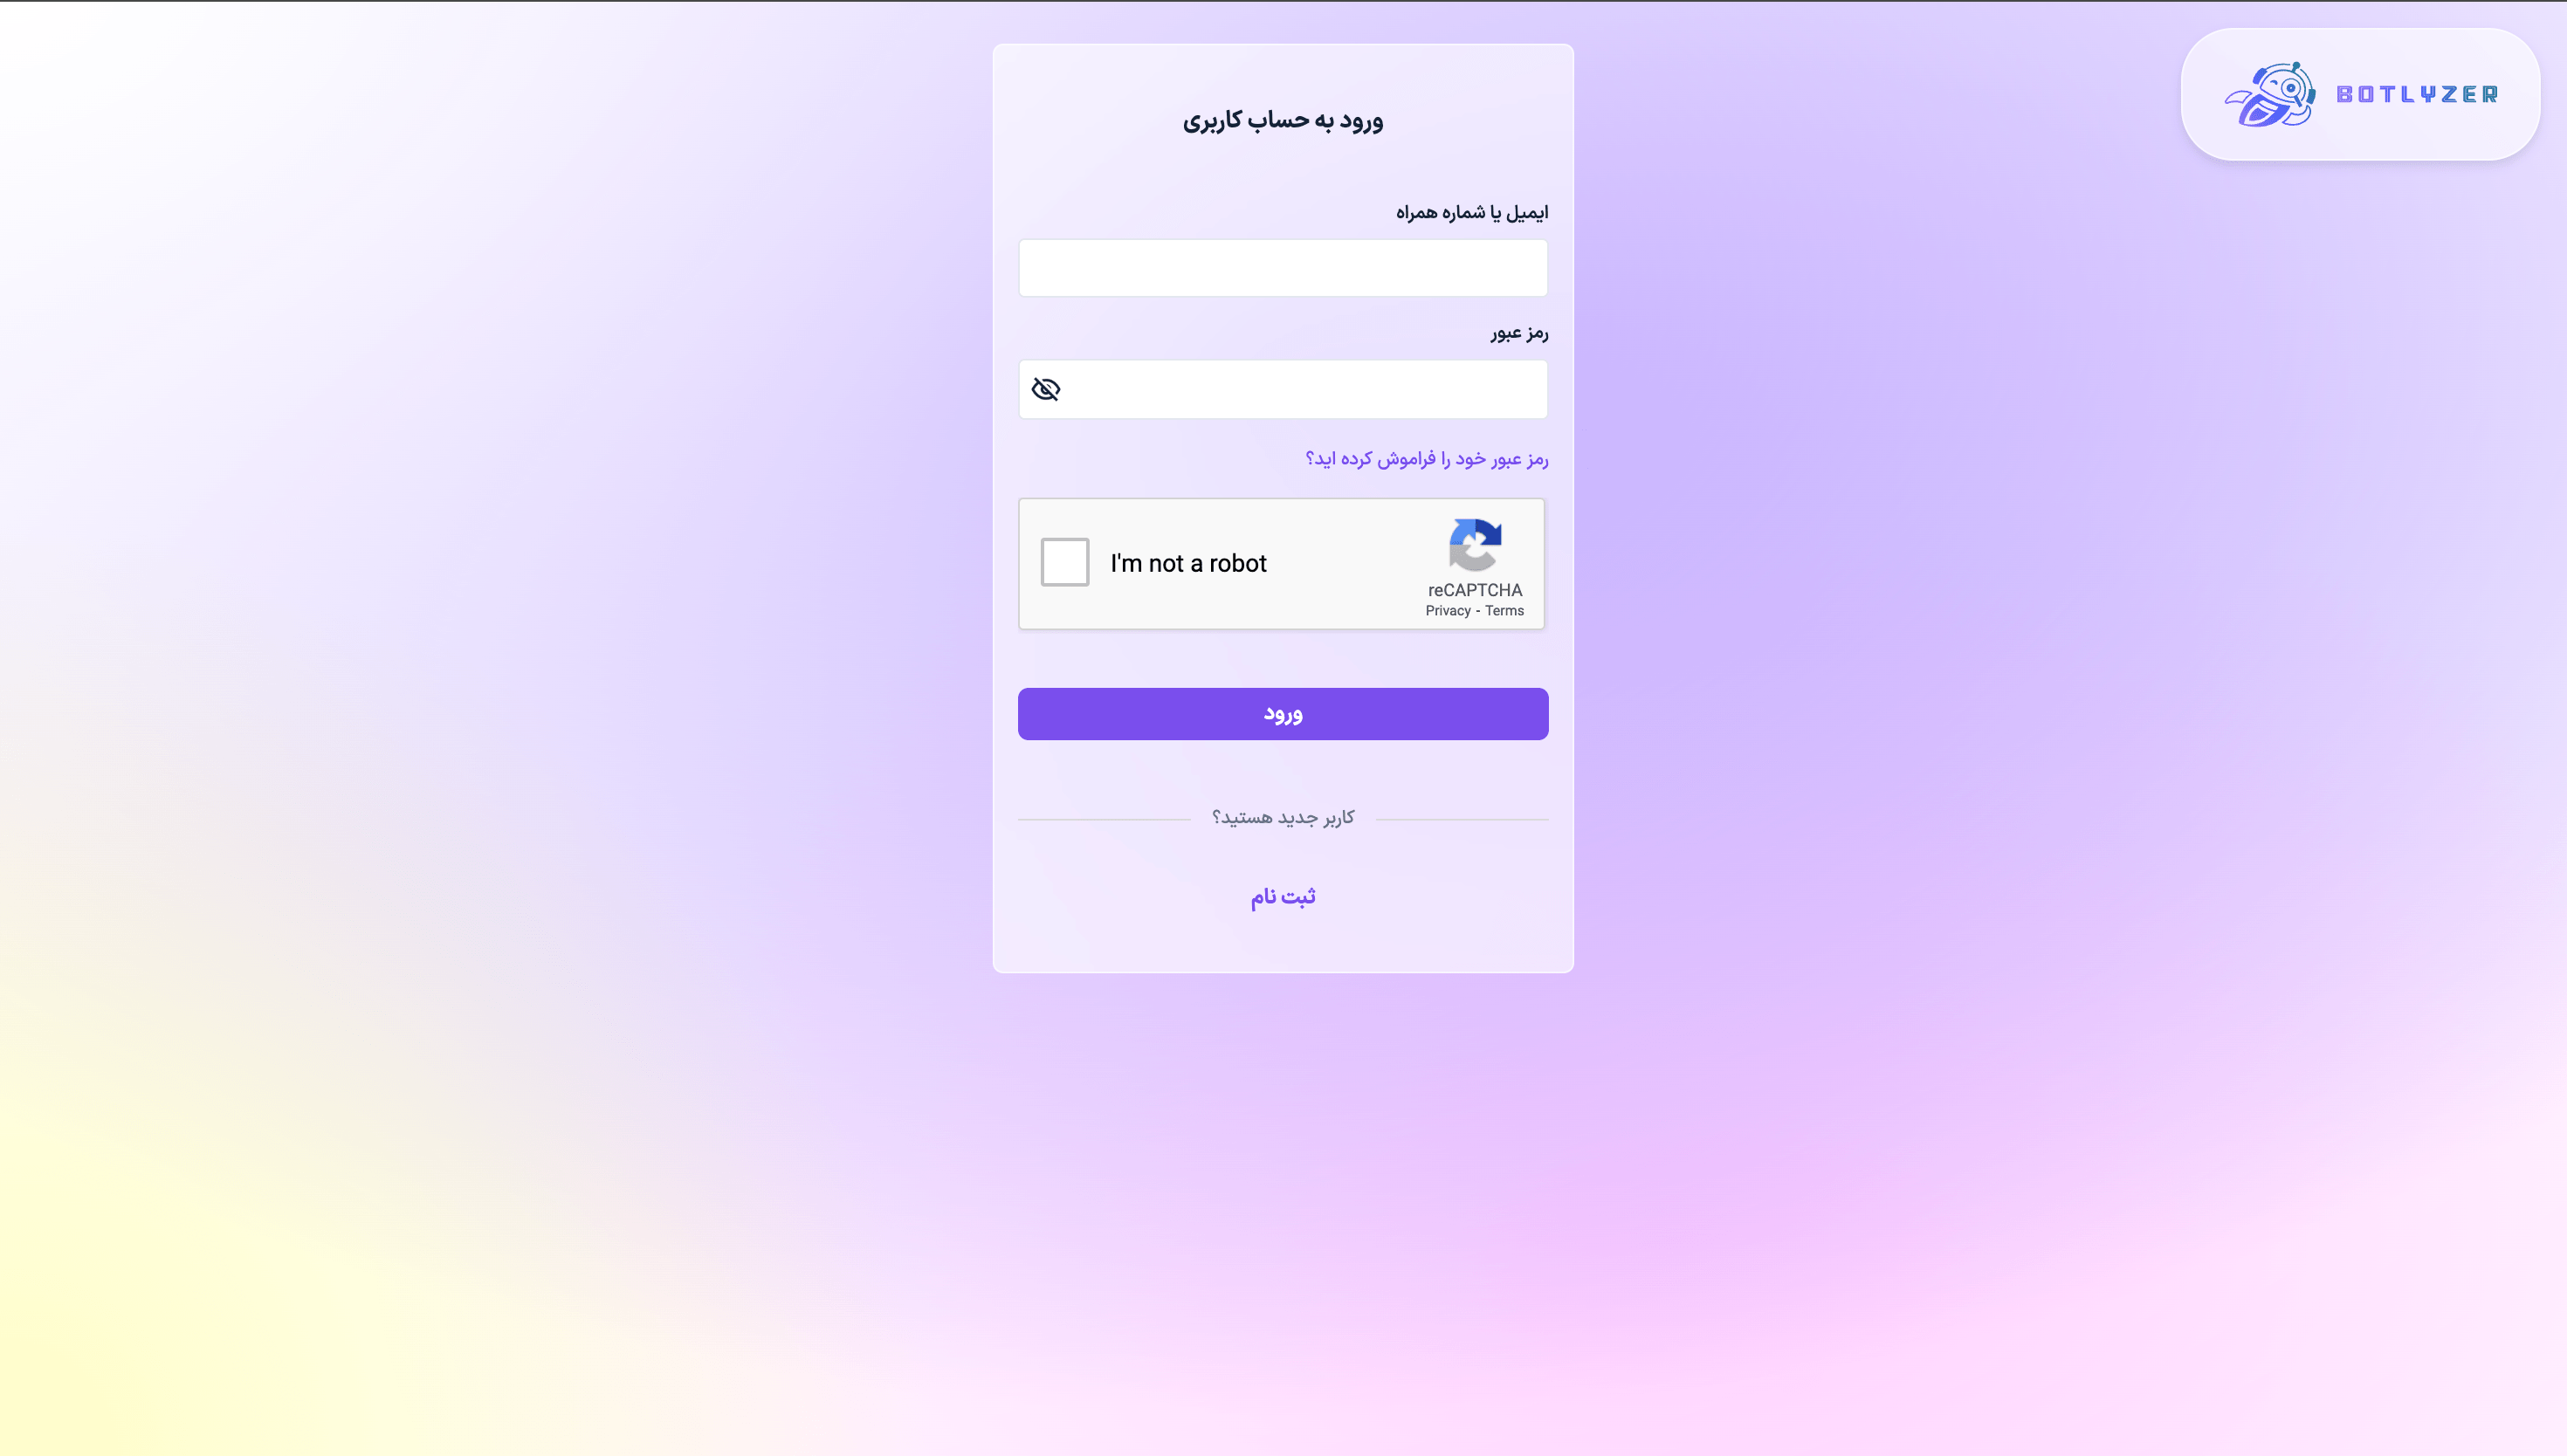
Authentication & authorization
Routing
Maintaining legacy code
Team collaboration
Real-time functionalities
Working with legacy codebases
Advanced state management
TradingView advanced chart
Petrochemical Bandar Imam (BIPC)
A dashboard for monitoring and managing pipelines in a petrochemical plant. Each pipeline carries gas or liquid, which must stay within a specific speed and pressure range. The dashboard visualizes pipeline data in various ways and alerts operators when any parameter goes out of range.API integration
WebSocket implementation
Pixel-perfect styling
Collaboration with the 3D team
Optimizing high-speed WebSocket communication
Performance optimization
SWR
Advanced MUI customization